Square Enix 2011 Annual Report Download - page 10
Download and view the complete annual report
Please find page 10 of the 2011 Square Enix annual report below. You can navigate through the pages in the report by either clicking on the pages listed below, or by using the keyword search tool below to find specific information within the annual report.-
 1
1 -
 2
2 -
 3
3 -
 4
4 -
 5
5 -
 6
6 -
 7
7 -
 8
8 -
 9
9 -
 10
10 -
 11
11 -
 12
12 -
 13
13 -
 14
14 -
 15
15 -
 16
16 -
 17
17 -
 18
18 -
 19
19 -
 20
20 -
 21
21 -
22
-
23
-
24
-
25
-
26
-
27
-
28
-
29
-
30
-
31
-
32
-
33
-
34
-
35
-
36
-
37
-
38
-
39
-
40
-
41
-
42
-
43
-
44
-
45
-
46
-
47
-
48
-
49
-
50
-
51
-
52
-
53
-
54
-
55
-
56
-
57
-
58
-
59
-
60
-
61
-
62
-
63
-
64
-
65
-
66
-
67
-
68
-
69
-
70
-
71
-
72
 |
 |
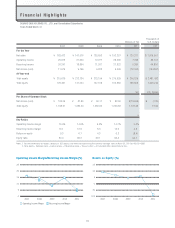
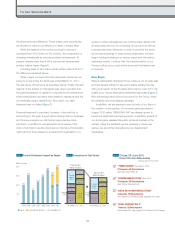
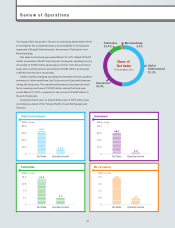
Review of Operations
The Square Enix Group (the “Group”) is continuing determined efforts
to strengthen the competitiveness and profitability of its business
segments of Digital Entertainment, Amusement, Publication and
Merchandising.
Net sales for the fiscal year ended March 31, 2011 totaled ¥125,271
million (a decrease of 34.8% from the prior fiscal year); operating income
amounted to ¥7,325 million (a decrease of 74.1% from the prior fiscal
year); and recurring income amounted to ¥5,390 million (a decrease
of 80.6% from the prior fiscal year).
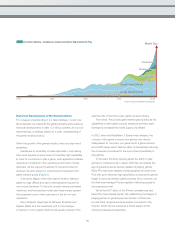
Under a rapidly changing operating environment and more prudent
estimates of future cash flows, the Group wrote-off goodwill balances
during the fiscal year. The resulting extraordinary loss was the main
factor causing a net loss of ¥12,043 million during the fiscal year
ended March 31, 2011, compared to net income of ¥9,509 million in
the prior fiscal year.
During the fiscal year, an extraordinary loss of ¥570 million was
recorded as a result of the Tohoku Pacific Ocean Earthquake and
Tsunami.
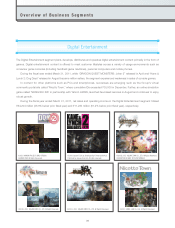
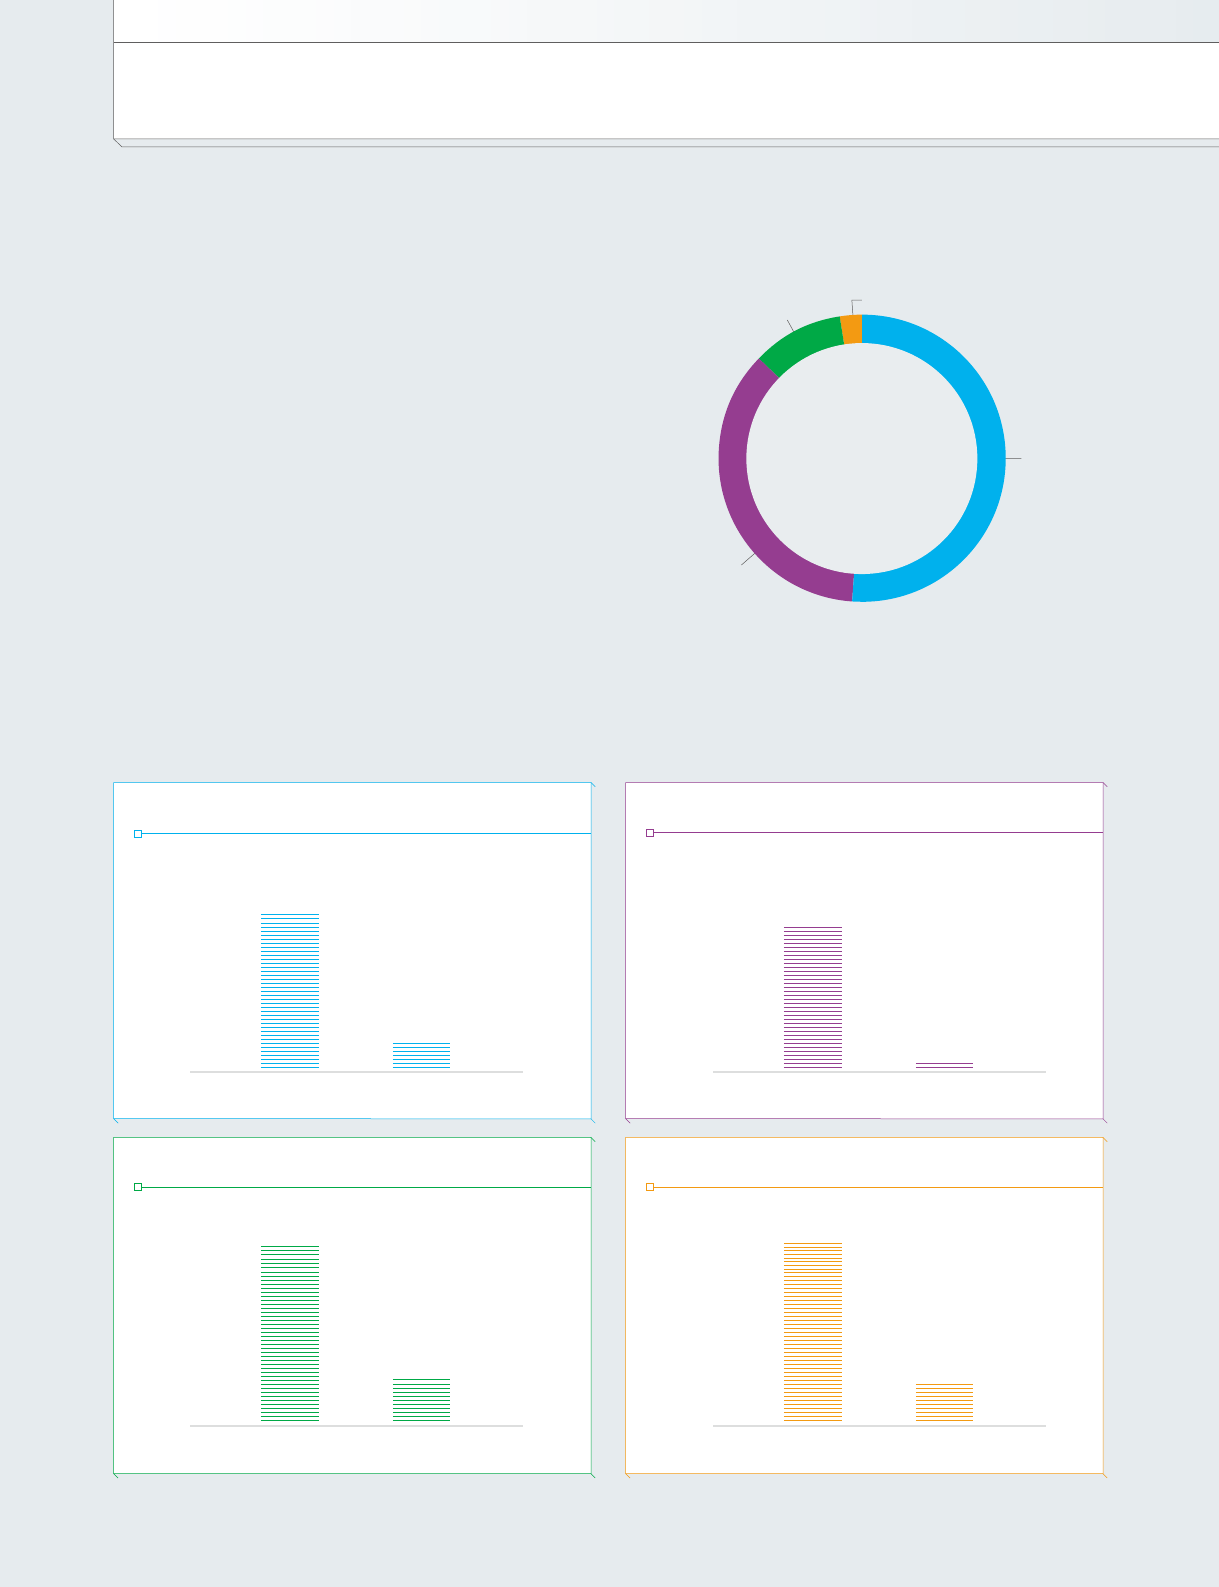
Digital Entertainment
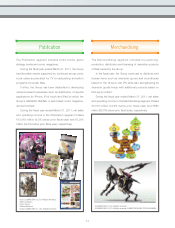
Publication
Amusement
Merchandising
Net Sales
(Billions of yen)
Operating Income
80.0
60.0
40.0
20.0
0
64.2
11.3
Net Sales
(Billions of yen)
Operating Income
60.0
45.0
30.0
15.0
0
45.0
2.2
Net Sales
(Billions of yen)
Operating Income
14.0
10.5
7.0
3.5
0
13.0
3.2
Net Sales
(Billions of yen)
Operating Income
3.2
2.4
1.6
0.8
0
3.0
0.7
10.4%
Publication
2.4%
Merchandising
51.3%
Digital
Entertainment
35.9%
Amusement
Share of
Net Sales
(FY Ended March 2011)
08