Square Enix 2011 Annual Report Download - page 26
Download and view the complete annual report
Please find page 26 of the 2011 Square Enix annual report below. You can navigate through the pages in the report by either clicking on the pages listed below, or by using the keyword search tool below to find specific information within the annual report.-
 1
1 -
2
-
3
-
4
-
5
-
6
-
7
-
8
-
9
-
10
-
11
-
12
-
13
-
14
-
15
-
 16
16 -
 17
17 -
 18
18 -
 19
19 -
 20
20 -
 21
21 -
 22
22 -
 23
23 -
 24
24 -
 25
25 -
 26
26 -
 27
27 -
 28
28 -
 29
29 -
 30
30 -
 31
31 -
 32
32 -
 33
33 -
 34
34 -
 35
35 -
 36
36 -
37
-
38
-
39
-
40
-
41
-
42
-
43
-
44
-
45
-
46
-
47
-
48
-
49
-
50
-
51
-
52
-
53
-
54
-
55
-
56
-
57
-
58
-
59
-
60
-
61
-
62
-
63
-
64
-
65
-
66
-
67
-
68
-
69
-
70
-
71
-
72
 |
 |

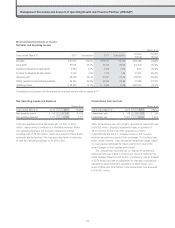
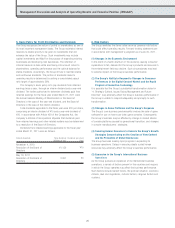
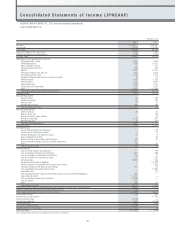
■ Consolidated Statements of Income
Net Sales and Operating Income
Comparisons by segment with the preceding fiscal year are provided on pages 8–11.
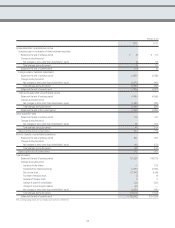
Extraordinary Gain and Loss
Under extraordinary loss, the Company recorded an impairment loss
of ¥8,853 million, including impairment losses on goodwill of
¥8,416 million. At the time of the acquisitions of TAITO
CORPORATION and the U.K. company Eidos plc, the Company
recorded goodwill as a result of both purchases. For the fiscal year
under review, however, it has recognized impairment losses, based
on more cautious estimates for future cash flow in view of the
recent changes in the business environment.
The Company also recorded loss on disposal of content and
equipment and loss related to content as a result of restructuring,
which together totaled ¥4,472 million, in addition to loss on disaster
of ¥570 million and loss on adjustment for changes in accounting
standard for asset retirement obligations of ¥462 million. As a
result of these and other factors, total extraordinary loss amounted
to ¥16,007 million.
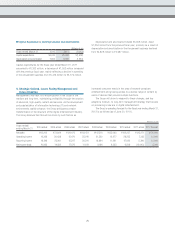
Management Discussion and Analysis of Operating Results and Financial Position (JPNGAAP)
Millions of yen
Years ended March 31 2010 Composition 2011 Composition Amount
change
Percent
change
Net sales ¥192,257 100.0% ¥125,271 100.0% ¥(66,986) (34.8)%
Gross profit 83,721 43.5% 49,424 39.5% (34,297) (41.0)%
Reversal of allowance for sales returns 4,863 2.5% 4,046 3.2% (817) (16.8)%
Provision for allowance for sales returns 4,046 2.1% 1,779 1.4% (2,267) (56.0)%
Net gross profit 84,538 44.0% 51,691 41.3% (32,847) (38.9)%
Selling, general and administrative expenses 56,303 29.3% 44,365 35.4% (11,938) (21.2)%
Operating income ¥ 28,235 14.7% ¥ 7,325 5.8% ¥(20,910) (74.1)%
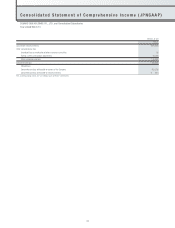
Non-Operating Income and Expenses
Total non-operating income decreased ¥411 million, to ¥347
million, mainly owing to a reduction in dividends received. Within
non-operating expenses, the Company registered a foreign
exchange loss of ¥2,149 million, mainly as a result of USD and GBP
exchange rate fluctuations. This loss was a key factor contributing
to total non-operating expenses of ¥2,282 million.
Millions of yen
Years ended March 31 2010 2011 Change
Extraordinary gain ¥ 128 ¥ 633 ¥ 505
Extraordinary loss 17,919 16,007 (1,912)
Millions of yen
Years ended March 31 2010 2011 Change
Non-operating income ¥ 758 ¥ 347 ¥ (411)
Non-operating expenses 1,171 2,282 1,111
24