Square Enix 2011 Annual Report Download - page 24
Download and view the complete annual report
Please find page 24 of the 2011 Square Enix annual report below. You can navigate through the pages in the report by either clicking on the pages listed below, or by using the keyword search tool below to find specific information within the annual report.-
 1
1 -
2
-
3
-
4
-
5
-
6
-
7
-
8
-
9
-
10
-
11
-
12
-
13
-
 14
14 -
 15
15 -
 16
16 -
 17
17 -
 18
18 -
 19
19 -
 20
20 -
 21
21 -
 22
22 -
 23
23 -
 24
24 -
 25
25 -
 26
26 -
 27
27 -
 28
28 -
 29
29 -
 30
30 -
 31
31 -
 32
32 -
 33
33 -
 34
34 -
35
-
36
-
37
-
38
-
39
-
40
-
41
-
42
-
43
-
44
-
45
-
46
-
47
-
48
-
49
-
50
-
51
-
52
-
53
-
54
-
55
-
56
-
57
-
58
-
59
-
60
-
61
-
62
-
63
-
64
-
65
-
66
-
67
-
68
-
69
-
70
-
71
-
72
 |
 |
and accounts receivable of ¥13,800 million, depreciation and
amortization of ¥6,608 million, and impairment loss of ¥8,853
million.
(2) Net Cash Provided by Investing Activities
Net cash provided by investing activities totaled ¥30,407 million, in
contrast with net cash used in investing activities of ¥53,774 million
in the previous fiscal year. Principal items contributing to this total
included proceeds from redemption of short-term securities of
¥35,000 million, proceeds from collection of guarantee deposits of
¥1,482 million, and purchase of property and equipment of ¥4,700
million.
(3) Net Cash Used in Financing Activities
Net cash used in financing activities amounted to ¥42,354 million,
compared with net cash provided by financing activities totaling
¥31,707 million in the previous fiscal year. The principal items were
redemption of bonds totaling ¥37,000 million and cash dividends paid
amounting to ¥4,026 million.
The Group believes that it will be possible to procure the funds
required for working capital and capital investments in the future to
maintain growth based on its sound financial standing and ability to
generate cash through operating activities.
3. Analysis of Business Performance in the Fiscal Year
Ended March 31, 2011
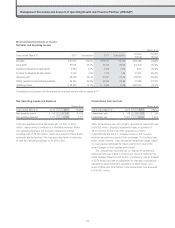
■ Assets
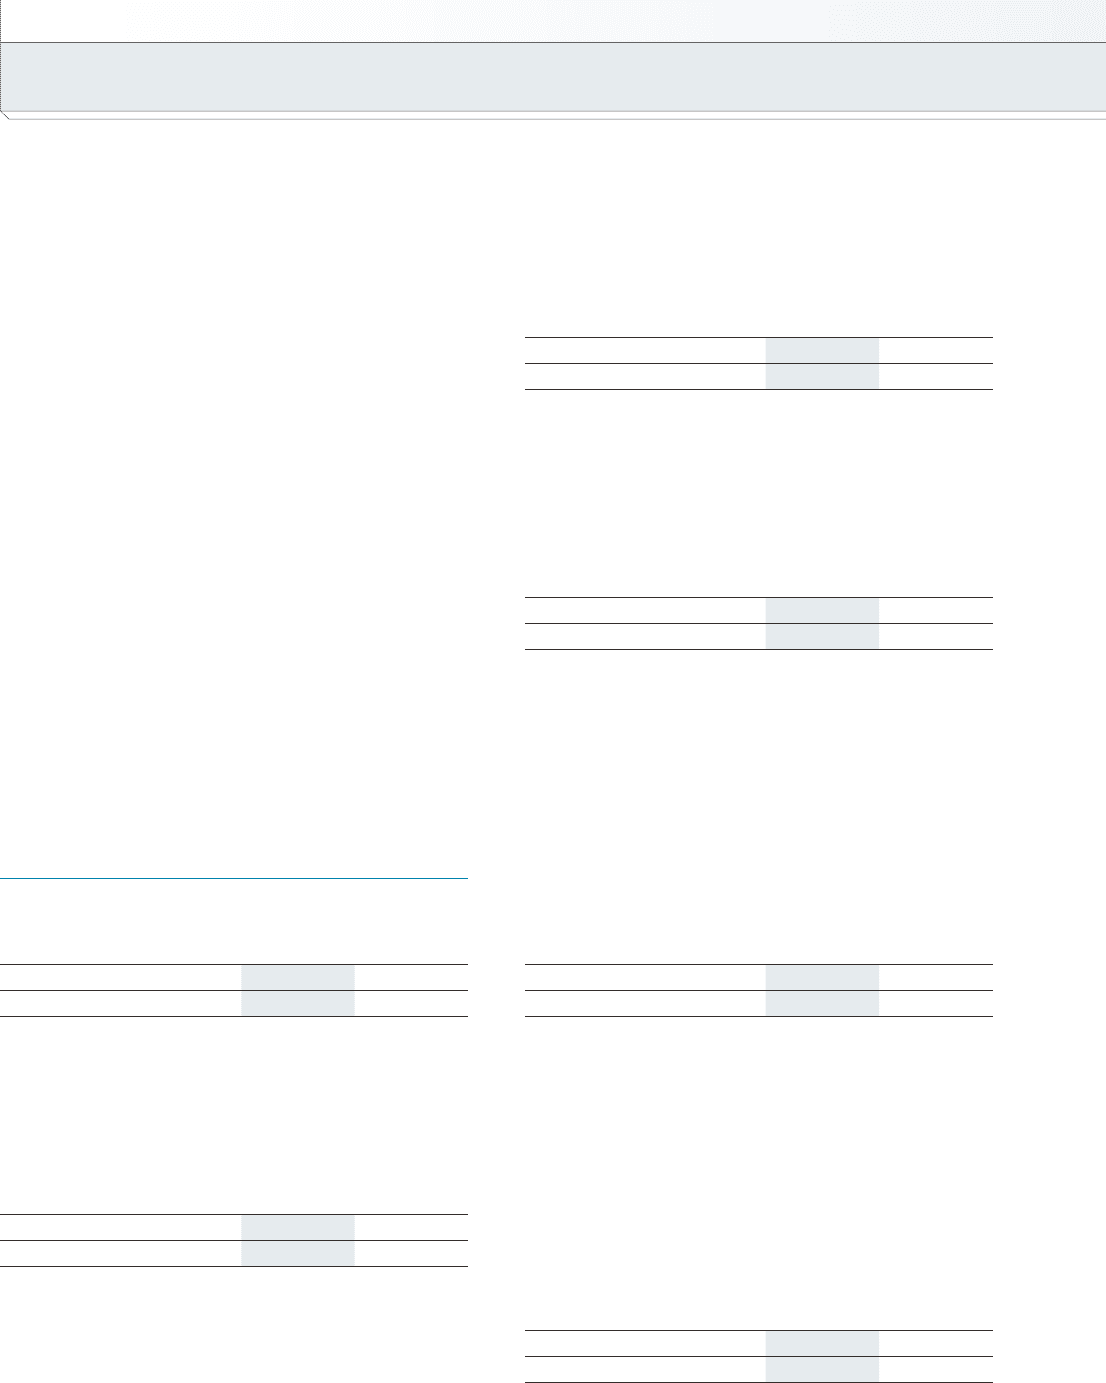
Total Assets
Total assets as of March 31, 2011 amounted to ¥206,336 million, a
decrease of ¥64,193 million compared with the previous fiscal
year-end. The main factors contributing to this change were as
follows:
Cash and Deposits
Short-Term Investment Securities
The Company used certificates of deposit (short-term investment
securities) amounting to ¥35,000 million for the redemption of yen-
denominated zero coupon bonds with warrants, which matured in
November 2010.
Notes and Accounts Receivable
The year-end balance of notes and accounts receivable varies
greatly depending on the timing of new game title releases.
In the fiscal year ended March 31, 2011, notes and accounts
receivable amounted to ¥15,474 million, down ¥15,208 million,
mainly owing to the absence of major game title releases during the
fourth quarter of the fiscal year under review. This situation
contrasted with the previous fiscal year in which “FINAL FANTASY
XIII,” “Just Cause 2” and other major titles were launched in the
United States and Europe during March.
Content Production Account
As a rule, content development costs incurred during the period
from a title’s formal development authorization through to its
release are capitalized in the content production account. When the
title is released, this amount is then recorded as an expense.
The content production account is reevaluated based on the
current business environment.
As of March 31, 2011, the content production account totaled
¥19,890 million, an increase of ¥3,865 million compared with the
end of the previous fiscal year.
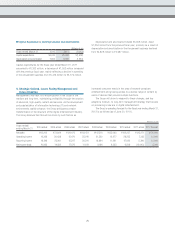
Non-Current Assets
At the end of the fiscal year under review, total property and
equipment stood at ¥17,328 million, down ¥1,522 million from the
end of the previous fiscal year, primarily owing to a decline in tools
Management Discussion and Analysis of Operating Results and Financial Position (JPNGAAP)
Millions of yen
March 31 2010 2011 Change
¥270,529 ¥206,336 ¥(64,193)
Millions of yen
March 31 2010 2011 Change
¥30,682 ¥15,474 ¥(15,208)
Millions of yen
March 31 2010 2011 Change
¥16,025 ¥19,890 ¥3,865
Millions of yen
March 31 2010 2011 Change
¥18,850 ¥17,328 ¥(1,522)
Millions of yen
March 31 2010 2011 Change
¥111,211 ¥111,126 ¥(85)
Millions of yen
March 31 2010 2011 Change
¥35,000 ¥— ¥(35,000)
22