Square Enix 2011 Annual Report Download - page 48
Download and view the complete annual report
Please find page 48 of the 2011 Square Enix annual report below. You can navigate through the pages in the report by either clicking on the pages listed below, or by using the keyword search tool below to find specific information within the annual report.-
 1
1 -
2
-
3
-
4
-
5
-
6
-
7
-
8
-
9
-
10
-
11
-
12
-
13
-
14
-
15
-
16
-
17
-
18
-
19
-
20
-
21
-
22
-
23
-
24
-
25
-
26
-
27
-
28
-
29
-
30
-
31
-
32
-
33
-
34
-
35
-
36
-
37
-
 38
38 -
 39
39 -
 40
40 -
 41
41 -
 42
42 -
 43
43 -
 44
44 -
 45
45 -
 46
46 -
 47
47 -
 48
48 -
 49
49 -
 50
50 -
 51
51 -
 52
52 -
 53
53 -
 54
54 -
 55
55 -
 56
56 -
 57
57 -
 58
58 -
59
-
60
-
61
-
62
-
63
-
64
-
65
-
66
-
67
-
68
-
69
-
70
-
71
-
72
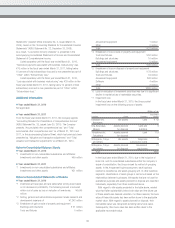
 |
 |
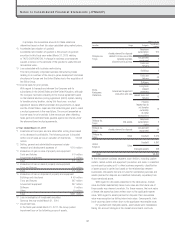
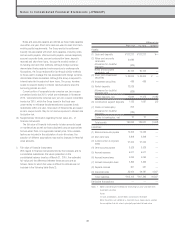
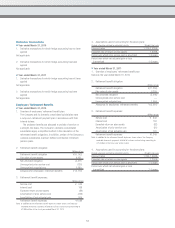
Total dividends Dividends per share
Date of approval Type of shares (Millions of yen) Source of dividends (Yen) Record date Effective date
May 18, 2011
(Board of Directors’ Meeting) Common stock ¥2,301 Retained earnings ¥20 March 31, 2011 June 23, 2011
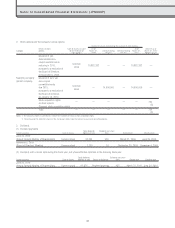
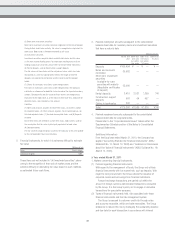
Notes to Consolidated Statements of Cash Flows
■ Year ended March 31, 2010
*1 A reconciliation of cash and cash equivalents in the consolidated
statements of cash flows to the corresponding amount disclosed in
the consolidated balance sheets is as follows:
(As of March 31, 2010)
Cash and deposits ¥111,211 million
Time deposits with maturity
periods over three months (1,494 million)
Cash and cash equivalents ¥109,717 million
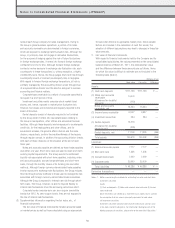
*2 Breakdown of principal assets and liabilities of companies newly
included in the Company’s scope of consolidation resulting from
share acquisition
Due to the inclusion of EIDOS LTD. and one affiliate of EIDOS
LTD. in the Company’s scope of consolidation through a share
acquisition, the following is a breakdown of principal assets
and liabilities at the time of the aforementioned commencement
of inclusion in the scope of consolidation as well as the share
acquisition costs and the relationship to the payment for share
acquisition—net.
Millions of yen
Current assets ¥ 7,849
Non-current assets 14,910
Goodwill 6,637
Current liabilities (14,654)
Non-current liabilities (223)
Share acquisition costs 14,519
Amount paid during the fiscal year ended
March 31, 2009 (1,503)
Cash and cash equivalents (814)
Payment for share acquisition—net ¥12,202
■ Year ended March 31, 2011
*1 A reconciliation of cash and cash equivalents in the consolidated
statements of cash flows to the corresponding amount disclosed in
the consolidated balance sheets is as follows:
(As of March 31, 2011)
Cash and deposits ¥111,126 million
Time deposits with maturity
periods over three months (1,375 million)
Cash and cash equivalents ¥109,751 million
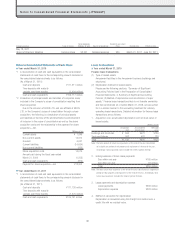
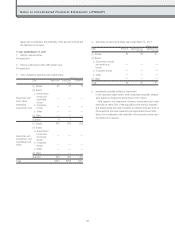
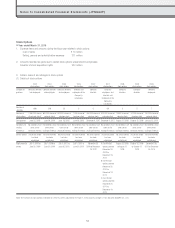
Notes to Consolidated Financial Statements (JPNGAAP)
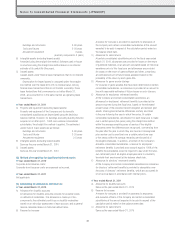
Lease Transactions
■ Year ended March 31, 2010
Finance lease transactions
(1) Type of leased assets
Amusement facilities in the Amusement business (buildings and
structures)
(2) Depreciation method for leased assets
Please see the following sections: “Summary of Significant
Accounting Policies Used in the Preparation of Consolidated
Financial Statements; 4. Summary of Significant Accounting
Policies; (2) Method of depreciation and amortization of major
assets.” Finance lease transactions that do not transfer ownership
and that commenced on or before March 31, 2008, are accounted
for in a similar manner to the accounting treatment for ordinary
operating lease transactions. Detailed information for finance lease
transactions are as follows:
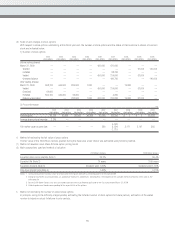
1. Acquisition cost, accumulated depreciation and net book value of
leased assets:
Millions of yen
Acquisition Accumulated Net book
cost depreciation value
Buildings and structures ¥ 593 ¥472 ¥120
Tools and fixtures 593 453 139
Total ¥1,186 ¥926 ¥259
Note: The total amount of future lease payments at the end of the year constituted
an insignificant portion of net property and equipment at the end of the year.
Accordingly, total acquisition cost included the interest portion thereon.
2. Ending balances of future lease payments:
Due within one year ¥165 million
Due after one year 94 million
Total ¥259 million
Note: The total future lease payments at the end of the year constituted an insignificant
portion of total property and equipment at the end of the year. Accordingly, total
future lease payments included the interest portion thereon.
3. Lease payments and depreciation expense:
Lease payments ¥338 million
Depreciation expense ¥338 million
4. Method of calculation for depreciation
Depreciation is calculated using the straight-line method over a
useful life with no residual value.
46