Square Enix 2011 Annual Report Download - page 32
Download and view the complete annual report
Please find page 32 of the 2011 Square Enix annual report below. You can navigate through the pages in the report by either clicking on the pages listed below, or by using the keyword search tool below to find specific information within the annual report.-
 1
1 -
2
-
3
-
4
-
5
-
6
-
7
-
8
-
9
-
10
-
11
-
12
-
13
-
14
-
15
-
16
-
17
-
18
-
19
-
20
-
21
-
 22
22 -
 23
23 -
 24
24 -
 25
25 -
 26
26 -
 27
27 -
 28
28 -
 29
29 -
 30
30 -
 31
31 -
 32
32 -
 33
33 -
 34
34 -
 35
35 -
 36
36 -
 37
37 -
 38
38 -
 39
39 -
 40
40 -
 41
41 -
 42
42 -
43
-
44
-
45
-
46
-
47
-
48
-
49
-
50
-
51
-
52
-
53
-
54
-
55
-
56
-
57
-
58
-
59
-
60
-
61
-
62
-
63
-
64
-
65
-
66
-
67
-
68
-
69
-
70
-
71
-
72
 |
 |
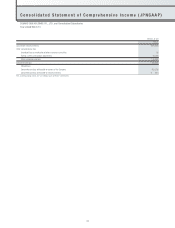
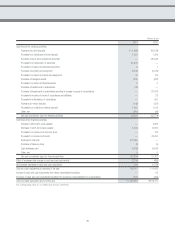
Millions of yen
2011 2010
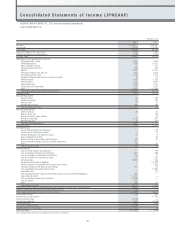
Net sales ¥ 125,271 ¥192,257
Cost of sales *1 75,846 *1 108,536
Gross profit 49,424 83,721
Reversal of allowance for sales returns 4,046 4,863
Provision for allowance for sales returns 1,779 4,046
Net gross profit 51,691 84,538
Selling, general and administrative expenses
Packaging freight charge 2,336 3,535
Advertising expense 7,935 11,053
Sales promotion expense 67 157
Compensation for directors 596 519
Salaries 12,534 15,145
Provision of allowance for bonuses 1,408 2,378
Net periodic pension costs 1,135 1,102
Provision to allowance for directors’ retirement benefits 15 13
Welfare expense 1,463 1,755
Rental expense 1,782 2,367
Commissions paid 4,228 4,105
Depreciation and amortization 1,903 2,281
Other *2 8,956 *2 11,886
Total selling, general and administrative expenses 44,365 56,303
Operating income 7,325 28,235
Non-operating income
Interest income 95 188
Dividends received 36 343
Rental income 24 30
Miscellaneous income 190 195
Total non-operating income 347 758
Non-operating expenses
Interest expenses 59 30
Bond issuance cost — 142
Investment loss on equity method —49
Foreign exchange loss 2,149 842
Miscellaneous loss 73 105
Total non-operating expenses 2,282 1,171
Recurring income 5,390 27,822
Extraordinary gain
Gain on sale of property and equipment *3 1*3 33
Gain on sale of investment securities 010
Reversal of allowance for doubtful accounts 94 9
Gain on forgiveness of debts —22
Gain on reversal of subscription rights to shares 125 20
Gain on reversal of foreign currency translation adjustments 317 —
Other 94 30
Total extraordinary gain 633 128
Extraordinary loss
Loss on sale of property and equipment *4 1*4 69
Loss on disposal of property and equipment *5 621 *5 389
Loss on liquidation of subsidiaries and affiliates 136 72
Loss on evaluation of investment securities *6 175 *6 166
Impairment loss *7 8,853 *7 255
Accelerated amortization of goodwill — *8 12,209
Severance payments associated with business restructuring — 1,985
Provision of allowance for game arcade closings 311 25
Loss associated with business restructuring — *9 1,860
Acquisition costs — 770
Loss on adjustment for changes of accounting standard for asset retirement obligations 462 —
Loss related to content *11 2,074 —
Loss on disposal of content and equipment *12 2,398 —
Loss on disaster *13 570 —
Other 398 114
Total extraordinary loss 16,007 17,919
Income (loss) before dividends distribution from silent partnership, income taxes (tokumei-kumiai) (9,983) 10,031
Dividends distribution from silent partnership (tokumei-kumiai) (12) 4
Income (loss) before income taxes and minority interests (9,970) 10,026
Income taxes–current 1,738 1,881
Income taxes for prior periods — *10 1,745
Refund of income taxes (2,249) —
Income taxes–deferred 2,594 (3,158)
Total income taxes 2,083 469
Loss before minority interests (12,054) —
Minority interests in income (loss) (11) 48
Net income (loss) ¥(12,043) ¥ 9,509
The accompanying notes are an integral part of these statements.
Consolidated Statements of Income (JPNGAAP)
SQUARE ENIX HOLDINGS CO., LTD. and Consolidated Subsidiaries
Years ended March 31
30