Square Enix 2011 Annual Report Download - page 27
Download and view the complete annual report
Please find page 27 of the 2011 Square Enix annual report below. You can navigate through the pages in the report by either clicking on the pages listed below, or by using the keyword search tool below to find specific information within the annual report.-
 1
1 -
2
-
3
-
4
-
5
-
6
-
7
-
8
-
9
-
10
-
11
-
12
-
13
-
14
-
15
-
16
-
 17
17 -
 18
18 -
 19
19 -
 20
20 -
 21
21 -
 22
22 -
 23
23 -
 24
24 -
 25
25 -
 26
26 -
 27
27 -
 28
28 -
 29
29 -
 30
30 -
 31
31 -
 32
32 -
 33
33 -
 34
34 -
 35
35 -
 36
36 -
 37
37 -
38
-
39
-
40
-
41
-
42
-
43
-
44
-
45
-
46
-
47
-
48
-
49
-
50
-
51
-
52
-
53
-
54
-
55
-
56
-
57
-
58
-
59
-
60
-
61
-
62
-
63
-
64
-
65
-
66
-
67
-
68
-
69
-
70
-
71
-
72
 |
 |
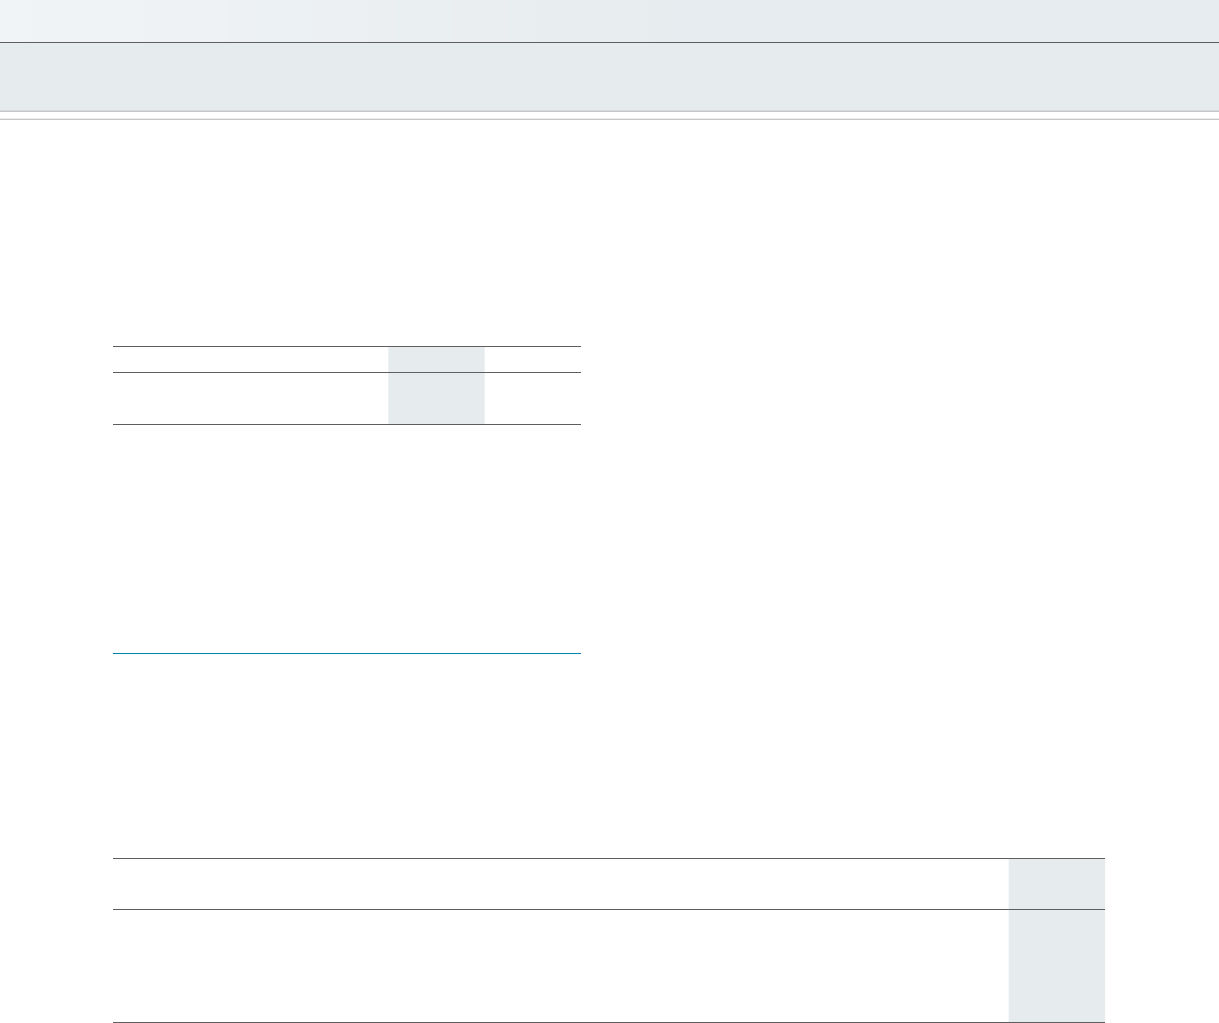
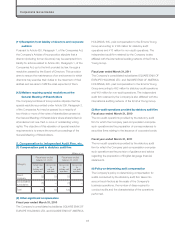
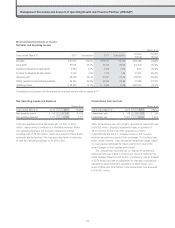
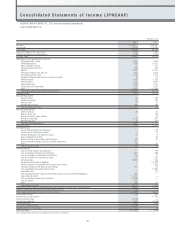
■ Capital Expenditures and Depreciation and Amortization
Capital expenditures for the fiscal year ended March 31, 2011
amounted to ¥5,363 million, a decrease of ¥1,553 million compared
with the previous fiscal year, mainly reflecting a decline in spending
in the Amusement business from ¥5,476 million to ¥3,779 million.
Millions of yen
Years ended March 31 2010 2011 Change
Capital expenditures ¥6,916 ¥5,363 ¥(1,553)
Depreciation and amortization
7, 9 62 6 ,6 0 8 ( 1, 3 5 4 )
Depreciation and amortization totaled ¥6,608 million, down
¥1,354 million from the previous fiscal year, primarily as a result of
depreciation and amortization in the Amusement business declined
from ¥4,828 million to ¥3,987 million.
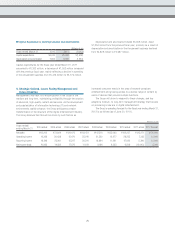
Millions of yen
Years ended/
ending March 31 2004 actual 2005 actual 2006 actual 2007 actual 2008 actual 2009 actual 2010 actual 2011 actual 2012 forecast
Net sales ¥63,202 ¥73,864 ¥124,473 ¥163,472 ¥147,516 ¥135,693 ¥192,257 ¥125,271 ¥130,000
Operating income 19,398 26,438 15,470 25,916 21,520 12,277 28,235 7,325 10,000
Recurring income 18,248 25,901 15,547 26,241 18,864 11,261 27,822 5,390 10,000
Net income (loss) 10,993 14,932 17,076 11,619 9,196 6,333 9,509 (12,043) 5,000
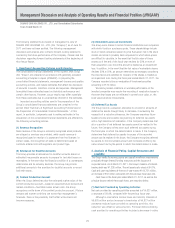
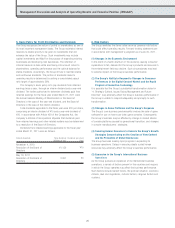
4. Strategic Outlook, Issues Facing Management and
Future Direction
Management’s key task is to ensure growth in the Group in the
medium and long term, maintaining profitability through the creation
of advanced, high-quality content and services. As the development
and popularization of information technology (IT) and network
environments rapidly advance, the Group anticipates a major
transformation in the structure of the digital entertainment industry.
The Group believes that this will be driven by such factors as
increased consumer needs in the area of network-compliant
entertainment and growing access to a diverse range of content by
users of devices that provide multiple functions.
The Group will strive to respond to these changes, and has
adopted a medium- to long-term management strategy that focuses
on pioneering a new era in digital entertainment.
The Group’s operating forecast for the fiscal year ending March 31,
2012 is as follows (as of June 30, 2011).
25