Square Enix 2011 Annual Report Download - page 63
Download and view the complete annual report
Please find page 63 of the 2011 Square Enix annual report below. You can navigate through the pages in the report by either clicking on the pages listed below, or by using the keyword search tool below to find specific information within the annual report.-
 1
1 -
2
-
3
-
4
-
5
-
6
-
7
-
8
-
9
-
10
-
11
-
12
-
13
-
14
-
15
-
16
-
17
-
18
-
19
-
20
-
21
-
22
-
23
-
24
-
25
-
26
-
27
-
28
-
29
-
30
-
31
-
32
-
33
-
34
-
35
-
36
-
37
-
38
-
39
-
40
-
41
-
42
-
43
-
44
-
45
-
46
-
47
-
48
-
49
-
50
-
51
-
52
-
 53
53 -
 54
54 -
 55
55 -
 56
56 -
 57
57 -
 58
58 -
 59
59 -
 60
60 -
 61
61 -
 62
62 -
 63
63 -
 64
64 -
 65
65 -
 66
66 -
 67
67 -
 68
68 -
 69
69 -
 70
70 -
 71
71 -
 72
72
 |
 |
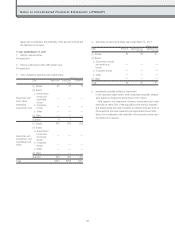
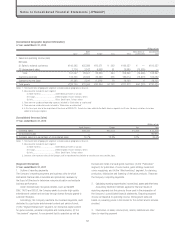
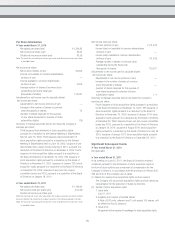
Matters Relating to Real Estate Leases, Etc.
■ Year ended March 31, 2010
Not applicable
■ Year ended March 31, 2011
Not applicable
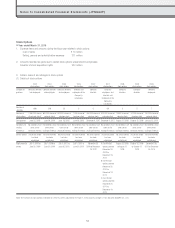
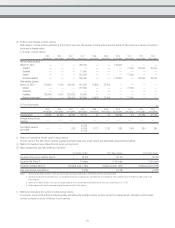
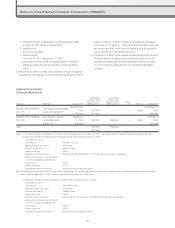
Segment Information
[Consolidated Business Segment Information]
■ Year ended March 31, 2010
Millions of yen
Games Amusement Publication Mobile Merchandising Total Eliminations or Consolidated
phone content unallocated total
I Sales and operating income (loss)
Net sales
(1) Sales to external customers ¥109,948 ¥52,299 ¥14,367 ¥10,171 ¥5,470 ¥192,257 ¥ — ¥ 192,257
(2) Intersegment sales 1 — — 0 2 3 (3) —
Total 109,949 52,299 14,367 10,171 5,473 192,261 (3) 192,257
Operating expenses 86,135 49,406 10,247 5,578 3,645 155,013 9,008 164,022
Operating income (loss) ¥ 23,814 ¥ 2,892 ¥ 4,120 ¥ 4,593 ¥1,827 ¥ 37,248 ¥ (9,012) ¥ 28,235
II Total assets, depreciation and
amortization, impairment loss
and capital expenditures
Total assets ¥ 92,502 ¥36,266 ¥10,033 ¥ 3,826 ¥4,025 ¥146,654 ¥123,874 ¥270,529
Depreciation and amortization 2,341 4,828 14 41 15 7,241 721 7,962
Impairment loss — 74 — — — 74 181 255
Capital expenditures ¥ 935 ¥ 5,476 ¥ 6 ¥ 23 ¥ 1 ¥ 6,443 ¥ 473 ¥ 6,916
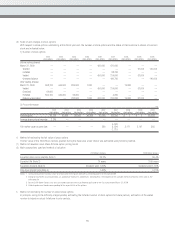
Notes: 1. The classification of business segments is made according to the types of products and services.
2. Principal products and services provided by each business segment are summarized as follows:
Segment Principal products and services
Games Games, online games
Amusement Amusement facility operation and rental, sales of amusement game machines
Publication Magazine comics, serial comics, game-related books
Mobile Phone Content Content for mobile phones
Merchandising Derivative products such as character merchandise
3. Unallocated operating expenses included in “Eliminations or unallocated” totaled ¥9,078 million. These expenses were related to administrative departments of the Company
which provide services and operational support that cannot be allocated to specific business segments.
4. Unallocated assets included in “Eliminations or unallocated” totaled ¥123,946 million. These assets mainly comprised cash and deposits, deferred tax assets and buildings
and structures of administrative departments of the Company.
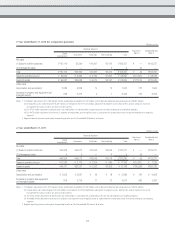
5. As described in the notes to Consolidated Statements of Income *8, the Company recorded accelerated amortization of goodwill.
6. Changes in allocation of operating expenses
While all of the expenses for the administration department of TAITO CORPORATION were previously included in the Amusement segment, these expenses have been included
in “Eliminations or unallocated” since the fiscal year ended March 31, 2010. The changes in allocation were made to clearly show each segment’s administrative expenses.
The operating expenses for the administration department of TAITO CORPORATION were as follows:
For the fiscal year ended March 31, 2010 ¥2,220 million
For the fiscal year ended March 31, 2009 ¥1,810 million
7. Due to the Company’s acquisition of Eidos Ltd. in the first quarter of the fiscal year ended March 31, 2010, the amount of total assets for the Game segment increased by
¥35,864 million.
61