Square Enix 2011 Annual Report Download - page 25
Download and view the complete annual report
Please find page 25 of the 2011 Square Enix annual report below. You can navigate through the pages in the report by either clicking on the pages listed below, or by using the keyword search tool below to find specific information within the annual report.-
 1
1 -
2
-
3
-
4
-
5
-
6
-
7
-
8
-
9
-
10
-
11
-
12
-
13
-
14
-
 15
15 -
 16
16 -
 17
17 -
 18
18 -
 19
19 -
 20
20 -
 21
21 -
 22
22 -
 23
23 -
 24
24 -
 25
25 -
 26
26 -
 27
27 -
 28
28 -
 29
29 -
 30
30 -
 31
31 -
 32
32 -
 33
33 -
 34
34 -
 35
35 -
36
-
37
-
38
-
39
-
40
-
41
-
42
-
43
-
44
-
45
-
46
-
47
-
48
-
49
-
50
-
51
-
52
-
53
-
54
-
55
-
56
-
57
-
58
-
59
-
60
-
61
-
62
-
63
-
64
-
65
-
66
-
67
-
68
-
69
-
70
-
71
-
72
 |
 |
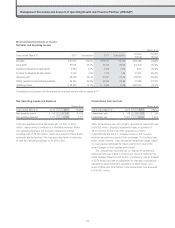
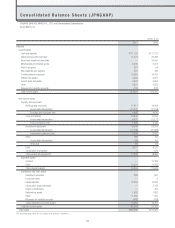
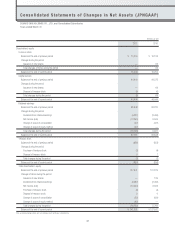
and fixtures (net) from ¥2,410 million to ¥1,808 million, and a
decrease in amusement equipment (net) from ¥2,832 million to
¥2,304 million.
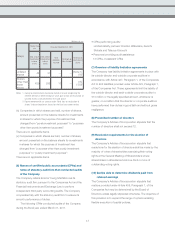
Intangible Assets
Total intangible assets as of March 31, 2011 amounted to ¥10,324
million, down ¥11,299 million, mainly reflecting impairment of goodwill.
Investments and Other Assets
Total investments and other assets decreased ¥2,325 million, to
¥14,382 million, at the end of the fiscal year under review, primarily
as a result of declines in rental deposits and construction support
deposits.
■ Liabilities
As of March 31, 2011, total liabilities amounted to ¥71,192 million,
a decrease of ¥45,079 million compared with the previous fiscal
year-end.
The main factors contributing to this change were as follows:
Current Liabilities
Total current liabilities decreased ¥46,753 million, to ¥28,504
million. This improvement was largely the result of a ¥37,000
million redemption of yen-denominated zero coupon bonds with
warrants, which matured in November 2010. Other key factors
included a decrease in notes and accounts payable from ¥10,666
million to ¥7,777 million, a decrease in short-term loans from
¥2,808 million to ¥1,338 million, a decrease in accrued income
taxes from ¥4,090 million to ¥2,269 million, and a decrease in
allowance for sales returns from ¥4,046 million to ¥1,780 million.
Non-Current Liabilities
Total non-current liabilities declined ¥1,674 million to ¥42,687
million, owing primarily to asset retirement obligations of ¥657 million
that resulted from the Company’s application of “Accounting
Standard for Asset Retirement Obligations” (ASBJ Statement No. 18).
Another principal factor was an increase in the allowance for
employees’ retirement benefits from ¥2,170 million to ¥3,061 million.
■ Shareholders’ Equity/Net Assets
As of March 31, 2011, total shareholders’ equity amounted to ¥141,501
million, a decrease of ¥16,140 million compared with the previous
fiscal year-end. This reflected the shift to a net loss, as well as the
payment of a year-end dividend for the previous fiscal year (¥25 per
share) and an interim dividend for the fiscal year under review (¥10
per share).
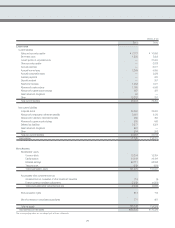
Millions of yen
March 31 2010 2011 Change
¥41,013 ¥42,687 ¥1,674
Millions of yen
March 31 2010 2011 Change
Common stock ¥ 15,204 ¥ 15,204 ¥ —
Capital surplus 44,444 44,444 —
Retained earnings 98,848 82,711 (16,137)
Treasury stock (856) (859) (3)
Total shareholders’ equity 157,641 141,501 (16,140)
Unrealized gain on
revaluation of other
investment securities
(9) (14) (5)
Foreign currency translation
adjustments (4,951) (7,929) (2,978)
Total accumulated other
comprehensive loss (4,960) (7,943) (2,983)
Stock acquisition rights 715 814 99
Minority interests in
consolidated subsidiaries 861 771 (90)
Total net assets ¥154,258 ¥135,143 ¥(19,115)
Millions of yen
March 31 2010 2011 Change
¥21,623 ¥10,324 ¥(11,299)
Millions of yen
March 31 2010 2011 Change
¥16,707 ¥14,382 ¥(2,325)
Millions of yen
March 31 2010 2011 Change
¥116,271 ¥71,192 ¥(45,079)
Millions of yen
March 31 2010 2011 Change
¥75,257 ¥28,504 ¥(46,753)
23