Square Enix 2011 Annual Report Download - page 3
Download and view the complete annual report
Please find page 3 of the 2011 Square Enix annual report below. You can navigate through the pages in the report by either clicking on the pages listed below, or by using the keyword search tool below to find specific information within the annual report.-
 1
1 -
 2
2 -
 3
3 -
 4
4 -
 5
5 -
 6
6 -
 7
7 -
 8
8 -
 9
9 -
 10
10 -
 11
11 -
 12
12 -
 13
13 -
 14
14 -
15
-
16
-
17
-
18
-
19
-
20
-
21
-
22
-
23
-
24
-
25
-
26
-
27
-
28
-
29
-
30
-
31
-
32
-
33
-
34
-
35
-
36
-
37
-
38
-
39
-
40
-
41
-
42
-
43
-
44
-
45
-
46
-
47
-
48
-
49
-
50
-
51
-
52
-
53
-
54
-
55
-
56
-
57
-
58
-
59
-
60
-
61
-
62
-
63
-
64
-
65
-
66
-
67
-
68
-
69
-
70
-
71
-
72
 |
 |
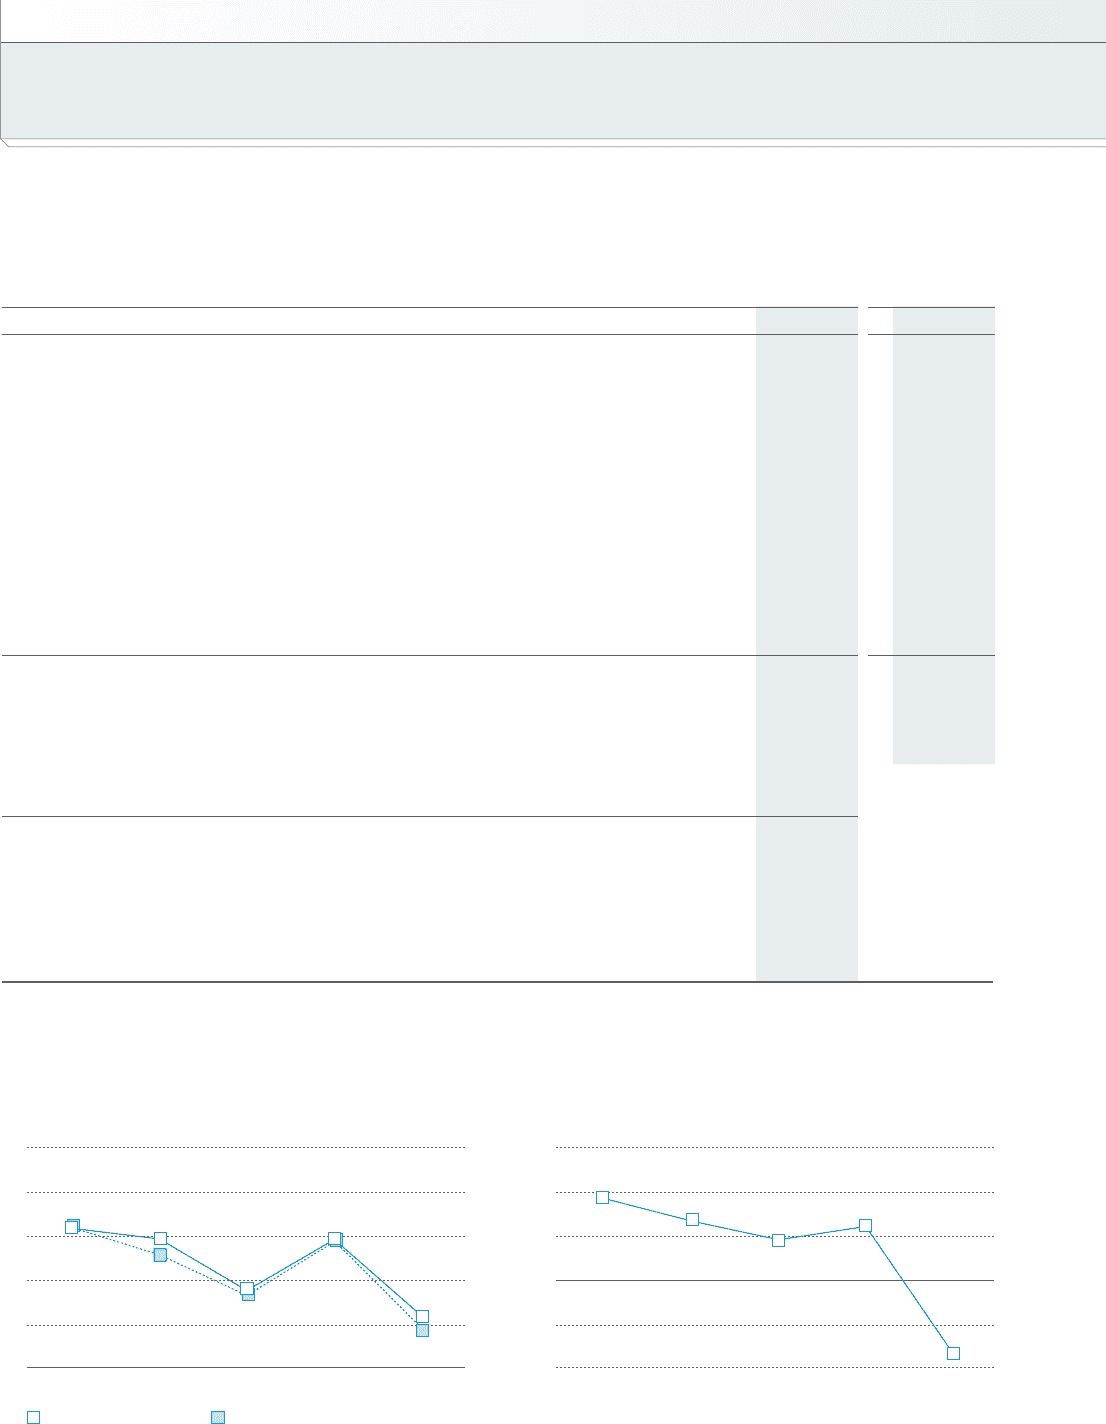
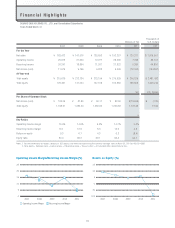
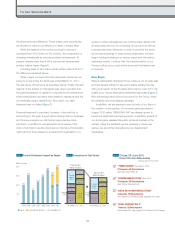
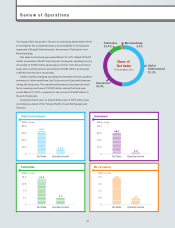
Operating Income Margin/Recurring Income Margin (%) Return on Equity (%)
Notes: 1. For the convenience of readers, amounts in U.S. dollars have been translated using the currency exchange rates at March 31, 2011 of ¥83.15=US$1.
2. Total equity = Common stock + Capital surplus + Retained earnings + Treasury stock + Accumulated other comprehensive loss
Thousands of
U.S. DollarsMillions of Yen
2007 2008 2009 2010 2011 2011
For the Year
Net sales ¥ 163,472 ¥ 147,516 ¥ 135,693 ¥ 192,257 ¥ 125,271 $ 1,506,567
Operating income 25,916 21,520 12,277 28,235 7,325 88,101
Recurring income 26,241 18,864 11,261 27,822 5,390 64,830
Net income (loss) 11,619 9,196 6,333 9,509 (12,043) (144,841)
At Year-end
Total assets ¥ 215,679 ¥ 212,134 ¥ 213,194 ¥ 270,529 ¥ 206,336 $ 2,481,492
Total equity 129,461 147,034 147,318 152,680 133,558 1,606,230
Yen U.S. Dollars
Per Share of Common Stock
Net income (loss) ¥ 105.06 ¥ 81.85 ¥ 55.11 ¥ 82.65 ¥(104.66) $ (1.26)
Total equity 1,168.91 1,280.50 1,280.92 1,326.82 1,160.66 13.96
%
Key Ratios
Operating income margin 15.9% 14.6% 9.0% 14.7% 5.8%
Recurring income margin 16.1 12.8 8.3 14.5 4.3
Return on equity 9.3 6.7 4.3 6.3 (8.4)
Equity ratio 60.0 69.3 69.1 56.4 64.7
Operating Income Margin Recurring Income Margin
25
20
15
10
5
0
20112007 2008 2009 2010
15
10
5
0
(5)
(10)
20112007 2008 2009 2010
Financial Highlights
SQUARE ENIX HOLDINGS CO., LTD. and Consolidated Subsidiaries
Years Ended March 31
01