Spirit Airlines 2012 Annual Report Download - page 85
Download and view the complete annual report
Please find page 85 of the 2012 Spirit Airlines annual report below. You can navigate through the pages in the report by either clicking on the pages listed below, or by using the keyword search tool below to find specific information within the annual report.-
 1
1 -
2
-
3
-
4
-
5
-
6
-
7
-
8
-
9
-
10
-
11
-
12
-
13
-
14
-
15
-
16
-
17
-
18
-
19
-
20
-
21
-
22
-
23
-
24
-
25
-
26
-
27
-
28
-
29
-
30
-
31
-
32
-
33
-
34
-
35
-
36
-
37
-
38
-
39
-
40
-
41
-
42
-
43
-
44
-
45
-
46
-
47
-
48
-
49
-
50
-
51
-
52
-
53
-
54
-
55
-
56
-
57
-
58
-
59
-
60
-
61
-
62
-
63
-
64
-
65
-
66
-
67
-
68
-
69
-
70
-
71
-
72
-
73
-
74
-
 75
75 -
 76
76 -
 77
77 -
 78
78 -
 79
79 -
 80
80 -
 81
81 -
 82
82 -
 83
83 -
 84
84 -
 85
85 -
 86
86 -
 87
87 -
 88
88 -
 89
89 -
 90
90 -
 91
91 -
 92
92 -
 93
93 -
 94
94 -
 95
95 -
96
-
97
-
98
-
99
-
100
-
101
-
102
 |
 |

Notes to Financial Statements—(Continued)
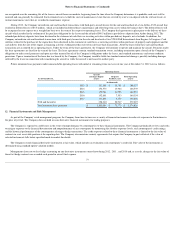
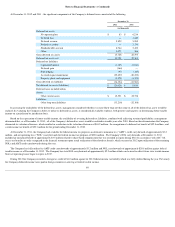
The following table presents the Company’s activity for assets measured at fair value on a recurring basis using significant unobservable inputs (Level 3):
The Company records the fair value adjustment of its aircraft fuel derivatives in the accompanying statement of operations within aircraft fuel and on the balance sheet
within other current assets or other current liabilities, depending on whether the net fair value of the derivatives is in an asset or liability position as of the respective date.
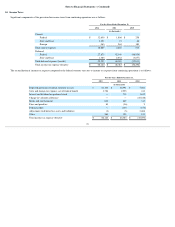
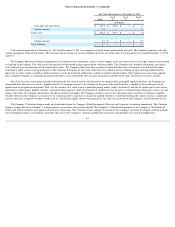
The Company is managed as a single business unit that provides air transportation for passengers. Operating revenues by geographic region as defined by the
Department of Transportation (DOT) area are summarized below:
During 2012 , 2011 , and 2010 , no revenue from any one foreign country represented greater than 4% of the Company’s total passenger revenue. The Company
attributes operating revenues by geographic region based upon the origin and destination of each passenger flight segment. The Company’s tangible assets consist primarily
of flight equipment, which are mobile across geographic markets and, therefore, have not been allocated.
On June 1, 2011, the Company raised $187.2 million of gross proceeds from an initial public offering of 15,600,000 shares of its common stock at a price of $12.00
per share. The resulting proceeds to the Company were approximately $176.9 million , after deducting underwriter commissions. The Company retained $150.0 million of
the net proceeds, after paying $20.6 million of debt, $0.5 million to pay three unaffiliated holders of its subordinated notes, and $5.9 million
in direct costs of the offering. In
accordance with a Recapitalization Agreement, all of the principal and accrued and unpaid interest on outstanding notes, to the extent not paid, totaling $279.2 million , as
well as all of the Class A and B preferred stock outstanding immediately prior to the offering along with accrued and unpaid dividends totaling $81.7 million , were
exchanged for 30,079,420 shares of common stock at a share price of $12.00 per share. Each share of Class B Common Stock was exchanged for one share of common
stock. In addition, interest expense was reduced by $0.4 million due to a write off of the unamortized portion of prepaid loan fees and deferred interest.
The Company entered into the TRA with the Pre-IPO Stockholders effective immediately prior to the consummation of the IPO. Under the TRA, the Company is
obligated to pay to the Pre-IPO Stockholders an amount equal to 90% of the cash savings in federal income tax realized by it by virtue of the use of the federal net operating
loss, deferred interest deductions and alternative minimum tax credits held by the Company as of March 31, 2011. Cash tax savings generally will be computed by
comparing actual federal income tax liability to the amount of such taxes that the Company would have been required to pay had such Pre-IPO NOLs (as defined in the
TRA) not been available. Upon consummation of the IPO and execution of the TRA, the Company recorded a liability with an offsetting reduction to additional paid in
capital. During 2012, management adjusted
84
Fuel Derivatives
(in millions)
Balance at January 1, 2010
$
1.4
Total realized or unrealized gains (losses) included in earnings, net
3.5
Settlements, net
(1.4
)
Balance at December 31, 2010
3.5
Total realized or unrealized gains (losses) included in earnings, net
4.2
Settlements, net
(7.4
)
Balance at December 31, 2011
0.3
Total realized or unrealized gains (losses) included in earnings, net
(0.2
)
Settlements, net
0.2
Balance at December 31, 2012
$
0.3
17.
Operating Segments and Related Disclosures
2012
2011
2010
(in millions)
DOT—domestic
$
1,135.1
$
900.1
$
625.0
DOT—Latin America
183.3
171.1
156.3
Total
$
1,318.4
$
1,071.2
$
781.3
18.
Initial Public Offering and Tax Receivable Agreement