Spirit Airlines 2012 Annual Report Download - page 83
Download and view the complete annual report
Please find page 83 of the 2012 Spirit Airlines annual report below. You can navigate through the pages in the report by either clicking on the pages listed below, or by using the keyword search tool below to find specific information within the annual report.-
 1
1 -
2
-
3
-
4
-
5
-
6
-
7
-
8
-
9
-
10
-
11
-
12
-
13
-
14
-
15
-
16
-
17
-
18
-
19
-
20
-
21
-
22
-
23
-
24
-
25
-
26
-
27
-
28
-
29
-
30
-
31
-
32
-
33
-
34
-
35
-
36
-
37
-
38
-
39
-
40
-
41
-
42
-
43
-
44
-
45
-
46
-
47
-
48
-
49
-
50
-
51
-
52
-
53
-
54
-
55
-
56
-
57
-
58
-
59
-
60
-
61
-
62
-
63
-
64
-
65
-
66
-
67
-
68
-
69
-
70
-
71
-
72
-
 73
73 -
 74
74 -
 75
75 -
 76
76 -
 77
77 -
 78
78 -
 79
79 -
 80
80 -
 81
81 -
 82
82 -
 83
83 -
 84
84 -
 85
85 -
 86
86 -
 87
87 -
 88
88 -
 89
89 -
 90
90 -
 91
91 -
 92
92 -
 93
93 -
94
-
95
-
96
-
97
-
98
-
99
-
100
-
101
-
102
 |
 |

Notes to Financial Statements—(Continued)
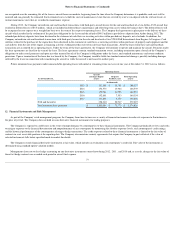
and adjusted periodically as necessary. The Company has accrued $1.9 million , $2.0 million , and $2.1 million for health care claims as of December 31, 2012 , 2011 and
2010 , respectively.
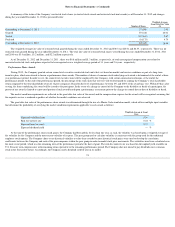
Other
The Company is contractually obligated to pay the following minimum guaranteed payments to the provider of its reservation system as of December 31, 2012 : $3.1
million in 2013 , $3.7 million in 2014 , $3.7 million in 2015 , $3.7 million in 2016 , $3.7 million in 2017 and $2.5 million in 2018 and thereafter .
The Company entered into a Tax Receivable Agreement (“TRA”) with the Company's Pre-IPO Stockholders (as defined in the TRA) that became effective
immediately prior to the consummation of the IPO. In accordance with the TRA, the Company paid $27.2 million , including $0.3 million of applicable interest, in the
second quarter of 2012. See Note 18.
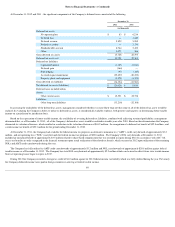
Under ASC 820, Fair Value Measurements and Disclosures , disclosures are required about how fair value is determined for assets and liabilities, and a hierarchy for
which these assets and liabilities must be grouped is established, based on significant levels of inputs, as follows:
Level 1 —Quoted prices in active markets for identical assets or liabilities.
Level 2 —Observable inputs other than Level 1 prices such as quoted prices for similar assets or liabilities; quoted prices in markets that are not active; or other inputs
that are observable or can be corroborated by observable market data for substantially the full term of the assets or liabilities.
Level 3 —Unobservable inputs that are supported by little or no market activity and that are significant to the fair value of the assets or liabilities.
Fair value is defined as the exchange price that would be received for an asset or paid to transfer a liability (an exit price) in the principal or most advantageous market
for the asset or liability in an orderly transaction between market participants on the measurement date. The Company utilizes several valuation techniques in order to assess
the fair value of the Company’s financial assets and liabilities. The Company’
s fuel derivative contracts, which primarily consist of costless collar contracts, are valued using
energy and commodity market data, which is derived by combining raw inputs with quantitative models and processes to generate forward curves and volatilities.
The Company utilizes the market approach to measure fair value for its financial assets and liabilities. The market approach uses prices and other relevant information
generated by market transactions involving identical or comparable assets or liabilities.
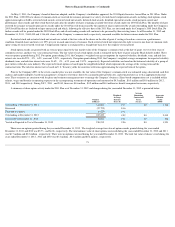
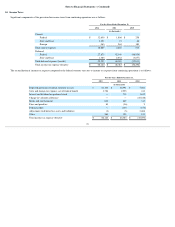
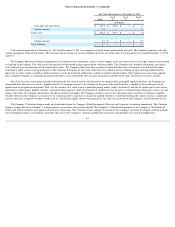
Assets and liabilities measured at fair value on a recurring basis are summarized below:
82
16.
Fair Value Measurements
Fair Value Measurements as of December 31, 2012
Total
Level
1
Level
2
Level
3
(in millions)
Cash and cash equivalents
$
416.8
$
416.8
$
—
$
—
Option contracts
0.3
—
—
0.3
Total assets
$
417.1
$
416.8
$
—
$
0.3
Total liabilities
$
—
$
—
$
—
$
—