Spirit Airlines 2012 Annual Report Download - page 46
Download and view the complete annual report
Please find page 46 of the 2012 Spirit Airlines annual report below. You can navigate through the pages in the report by either clicking on the pages listed below, or by using the keyword search tool below to find specific information within the annual report.-
 1
1 -
2
-
3
-
4
-
5
-
6
-
7
-
8
-
9
-
10
-
11
-
12
-
13
-
14
-
15
-
16
-
17
-
18
-
19
-
20
-
21
-
22
-
23
-
24
-
25
-
26
-
27
-
28
-
29
-
30
-
31
-
32
-
33
-
34
-
35
-
 36
36 -
 37
37 -
 38
38 -
 39
39 -
 40
40 -
 41
41 -
 42
42 -
 43
43 -
 44
44 -
 45
45 -
 46
46 -
 47
47 -
 48
48 -
 49
49 -
 50
50 -
 51
51 -
 52
52 -
 53
53 -
 54
54 -
 55
55 -
 56
56 -
57
-
58
-
59
-
60
-
61
-
62
-
63
-
64
-
65
-
66
-
67
-
68
-
69
-
70
-
71
-
72
-
73
-
74
-
75
-
76
-
77
-
78
-
79
-
80
-
81
-
82
-
83
-
84
-
85
-
86
-
87
-
88
-
89
-
90
-
91
-
92
-
93
-
94
-
95
-
96
-
97
-
98
-
99
-
100
-
101
-
102
 |
 |

2011 compared to 2010
Operating revenues increase d by $289.9 million , or 37.1% , to $1,071.2 million in 2011 compared to $781.3 million in 2010 . Our capacity in terms of ASMs
increase d 15.2% during 2011 compared to 2010 , primarily driven by the addition of Airbus 320 aircraft, five of which were delivered during 2011, and the full-year effect
of our four 2010 deliveries. Our traffic as measured in terms of RPMs increased by 20.1% during 2011 compared to 2010 . Our aircraft operated an average of 12.7 hours
daily with 85.6% of the seats full during 2011 compared to an average of 12.8 hours daily with 82.1% of the seats full during 2010 .
Within operating revenues, passenger ticket revenue increase d by 28.2% to $689.7 million in 2011 compared to $538.0 million in 2010 . This increase was driven
primarily by a 22.5% increase in passenger segments in 2011 compared to 2010 .
Non-ticket revenues increase d by $138.2 million in 2011 compared to 2010 , a 56.8% increase primarily driven by the 22.5% increase in passenger flight segments
and price enhancements on non-ticket services. During the first quarter of 2011, we reduced the weight threshold for overweight baggage from 50 pounds to 40 pounds and
increased the amount charged to customers for modifying or canceling their reservations. During the second quarter of 2011, we increased bag rates purchased at check-
in on
the web, the airport, and at the kiosk. During the second half of 2011, we began our efforts to standardize our passenger usage fee across all markets and fare classes. As a
result of experienced continued growth in revenue from many previously adopted non-ticket revenue initiatives, our non-ticket revenue per passenger flight segment
increase
d 28.0% to $44.79 for 2011 from $35.00 for 2010 .
Effective April 1, 2011, we entered into a new five-year affinity card program for the issuance of our FREE SPIRIT credit cards with a new administrator. During
2010, we determined not to renew our agreement with the former administrator of our FREE SPIRIT affinity credit card program at the scheduled expiration in February
2011. In connection with that non-renewal, we entered into an agreement with the former administrator regarding the transition of the program to the new provider and the
remittance to us of compensation due to us for card members obtained through our marketing services in the amount of $5.0 million, of which $0.4 million was recognized
in the first quarter of 2011 and $4.6 million was recognized in the fourth quarter of 2010.
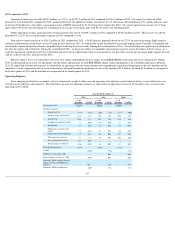
Operating Expenses
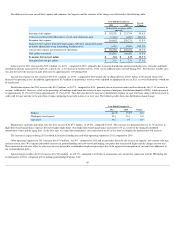
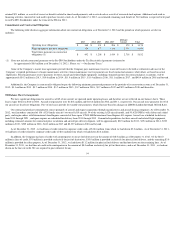
Since adopting our ultra low-cost model, we have continuously sought to reduce our unit operating costs and have created what we believe is one of the lowest cost
structures in our industry in the Americas. The table below presents our operating expenses, as a percentage of operating revenue for the last three years, as well as unit
operating costs (CASM).
45
Year Ended December 31,
2012
2011
2010
% of
Revenue
CASM
% of
Revenue
CASM
% of
Revenue
CASM
Operating revenue
100.0
%
100.0
%
100.0
%
Operating expenses:
Aircraft fuel (1)
35.8
%
4.16
¢
36.2
%
4.15
¢
31.8
%
3.06
¢
Salaries, wages, and benefits
16.6
1.93
17.0
1.94
20.0
1.93
Aircraft rent
10.9
1.27
10.9
1.25
13.0
1.25
Landing fees and other rentals
5.2
0.60
4.9
0.56
6.2
0.59
Distribution
4.3
0.50
4.8
0.55
5.3
0.51
Maintenance, materials and
repairs
3.8
0.44
3.3
0.38
3.6
0.35
Depreciation and amortization
1.2
0.13
0.7
0.08
0.7
0.07
Other operating expenses
9.7
1.13
8.4
0.96
10.6
1.02
Loss on disposal of assets
0.1
0.01
—
—
—
—
Special charges (credits) (2)
(0.6
)
(0.07
)
0.3
0.03
0.1
0.01
Total operating expense
86.8
%
86.5
%
91.2
%
CASM
10.09
¢
9.91
¢
8.77
¢
MTM losses (gains)per ASM
—
0.03
0.03
Special charges (credits) per ASM
(0.07
)
0.03
0.01
Adjusted CASM (excludes Special
charges (credits) and MTM gains
(losses))
10.15
9.84
8.79
Adjusted CASM excluding fuel
6.00
5.72
5.71