Spirit Airlines 2012 Annual Report Download - page 33
Download and view the complete annual report
Please find page 33 of the 2012 Spirit Airlines annual report below. You can navigate through the pages in the report by either clicking on the pages listed below, or by using the keyword search tool below to find specific information within the annual report.-
 1
1 -
2
-
3
-
4
-
5
-
6
-
7
-
8
-
9
-
10
-
11
-
12
-
13
-
14
-
15
-
16
-
17
-
18
-
19
-
20
-
21
-
22
-
 23
23 -
 24
24 -
 25
25 -
 26
26 -
 27
27 -
 28
28 -
 29
29 -
 30
30 -
 31
31 -
 32
32 -
 33
33 -
 34
34 -
 35
35 -
 36
36 -
 37
37 -
 38
38 -
 39
39 -
 40
40 -
 41
41 -
 42
42 -
 43
43 -
44
-
45
-
46
-
47
-
48
-
49
-
50
-
51
-
52
-
53
-
54
-
55
-
56
-
57
-
58
-
59
-
60
-
61
-
62
-
63
-
64
-
65
-
66
-
67
-
68
-
69
-
70
-
71
-
72
-
73
-
74
-
75
-
76
-
77
-
78
-
79
-
80
-
81
-
82
-
83
-
84
-
85
-
86
-
87
-
88
-
89
-
90
-
91
-
92
-
93
-
94
-
95
-
96
-
97
-
98
-
99
-
100
-
101
-
102
 |
 |
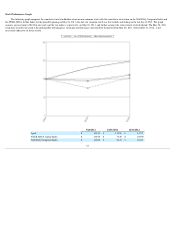
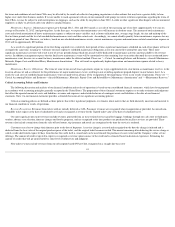
Stock Performance Graph
The following graph compares the cumulative total stockholder return on our common stock with the cumulative total return on the NASDAQ Composite Index and
the NYSE ARCA Airline Index for the period beginning on May 26, 2011 (the date our common stock was first traded) and ending on the last day of 2012. The graph
assumes an investment of $100 in our stock and the two indices, respectively, on May 26, 2011, and further assumes the reinvestment of all dividends. The May 26, 2011
stock price used for our stock is the initial public offering price. Stock price performance, presented for the period from May 26, 2011 to December 31, 2012 , is not
necessarily indicative of future results.
32
5/26/2011
12/31/2011
12/31/2012
Spirit
$
100.00
$
130.00
$
147.75
NYSE ARCA Airline Index
$
100.00
$
75.49
$
103.90
NASDAQ Composite Index
$
100.00
$
94.23
$
110.91