Spirit Airlines 2012 Annual Report Download - page 49
Download and view the complete annual report
Please find page 49 of the 2012 Spirit Airlines annual report below. You can navigate through the pages in the report by either clicking on the pages listed below, or by using the keyword search tool below to find specific information within the annual report.-
 1
1 -
2
-
3
-
4
-
5
-
6
-
7
-
8
-
9
-
10
-
11
-
12
-
13
-
14
-
15
-
16
-
17
-
18
-
19
-
20
-
21
-
22
-
23
-
24
-
25
-
26
-
27
-
28
-
29
-
30
-
31
-
32
-
33
-
34
-
35
-
36
-
37
-
38
-
 39
39 -
 40
40 -
 41
41 -
 42
42 -
 43
43 -
 44
44 -
 45
45 -
 46
46 -
 47
47 -
 48
48 -
 49
49 -
 50
50 -
 51
51 -
 52
52 -
 53
53 -
 54
54 -
 55
55 -
 56
56 -
 57
57 -
 58
58 -
 59
59 -
60
-
61
-
62
-
63
-
64
-
65
-
66
-
67
-
68
-
69
-
70
-
71
-
72
-
73
-
74
-
75
-
76
-
77
-
78
-
79
-
80
-
81
-
82
-
83
-
84
-
85
-
86
-
87
-
88
-
89
-
90
-
91
-
92
-
93
-
94
-
95
-
96
-
97
-
98
-
99
-
100
-
101
-
102
 |
 |

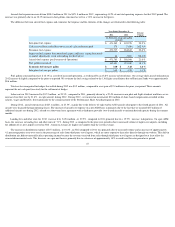
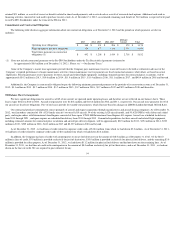
The following table shows our distribution channel usage:
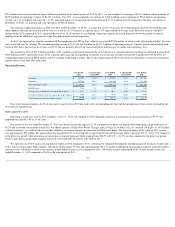
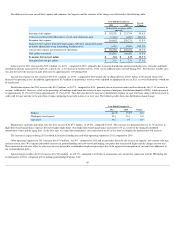
Maintenance, materials and repair costs increase d by $15.4 million , or 45.4% , in 2012 . The increase in maintenance costs is primarily due to $6.8 million in one-
time start-up costs of the seat maintenance program, which was introduced and completed in 2012. We do not expect the ongoing expense of our seat maintenance program
to have a material impact on our overall future maintenance cost outlook. The average age of our fleet increased to 4.6 years as of December 31, 2012 from 4.5 years as of
December 31, 2011 . Maintenance expense is expected to increase significantly as our fleet continues to age, resulting in the need for additional repairs over time.
Depreciation and amortization increase d by $7.5 million , or 96.6% , primarily due to deferred heavy aircraft maintenance events, which in turn resulted in higher
amortization expense recorded in 2012 compared to the prior year period.
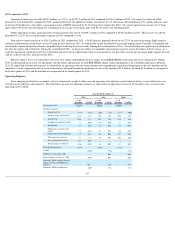
Other operating expenses in 2012 increase d by $36.7 million , or 40.3% , compared to 2011 primarily due to an increase in departures of 19.9% . Overall increased
rates at the airports we serve resulted in increased variable operating costs such as ground handling expenses and travel and lodging expense in 2012 compared to the prior
year. The increase on a per-ASM basis of 17.7% is primarily due to a shift in our route network to include higher volumes at the higher-cost airports we serve. In addition,
we experienced increases in travel and lodging costs driven by both volume and hotel rate increases associated with increased training and scope of operations, as well as
higher passenger re-accommodation expenses associated with slightly higher flight cancellations during 2012 . We also incurred additional expenses related to the
implementation of an Enterprise Resource Planning (ERP) system.
Special charges (credits) for 2012 primarily include a $9.1 million gain related to the sale of four
permanent air carrier slots at Ronald Reagan National Airport (DCA),
offset by $0.6 million in secondary offering costs. Special charges (credits) for 2011 relate to termination costs of $2.6 million in connection with our IPO, including $1.8
million paid to Indigo Partners, LLC to terminate its professional services agreement with us and $0.5 million paid to three individual, unaffiliated holders of our
subordinated notes.
2011 compared to 2010
Our operating expenses increase d by $214.4 million , or 30.1% , for 2011 compared to the corresponding period in 2010 . The increase is primarily related to a 56.3%
increase in fuel costs, 16.2% increase in labor cost, and a 14.9% increase in aircraft rent.
Aircraft fuel expense for 2011 increase d $139.8 million , or 56.3% , compared to the prior year period due to a 35.3% increase in the average price of aircraft fuel per
gallon and a 13.5% increase in gallons consumed. Aircraft fuel expense represented 41.9% of our total operating expenses for 2011 .
48
Year Ended December 31,
2012
2011
Change
Website
64.2
%
66.3
%
(2.1
)
Third-party travel agents
27.2
23.1
4.1
Call center
8.6
10.6
(2.0
)