Spirit Airlines 2012 Annual Report Download - page 45
Download and view the complete annual report
Please find page 45 of the 2012 Spirit Airlines annual report below. You can navigate through the pages in the report by either clicking on the pages listed below, or by using the keyword search tool below to find specific information within the annual report.-
 1
1 -
2
-
3
-
4
-
5
-
6
-
7
-
8
-
9
-
10
-
11
-
12
-
13
-
14
-
15
-
16
-
17
-
18
-
19
-
20
-
21
-
22
-
23
-
24
-
25
-
26
-
27
-
28
-
29
-
30
-
31
-
32
-
33
-
34
-
 35
35 -
 36
36 -
 37
37 -
 38
38 -
 39
39 -
 40
40 -
 41
41 -
 42
42 -
 43
43 -
 44
44 -
 45
45 -
 46
46 -
 47
47 -
 48
48 -
 49
49 -
 50
50 -
 51
51 -
 52
52 -
 53
53 -
 54
54 -
 55
55 -
56
-
57
-
58
-
59
-
60
-
61
-
62
-
63
-
64
-
65
-
66
-
67
-
68
-
69
-
70
-
71
-
72
-
73
-
74
-
75
-
76
-
77
-
78
-
79
-
80
-
81
-
82
-
83
-
84
-
85
-
86
-
87
-
88
-
89
-
90
-
91
-
92
-
93
-
94
-
95
-
96
-
97
-
98
-
99
-
100
-
101
-
102
 |
 |

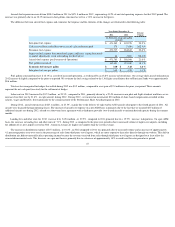
$25 million in lost revenues from the impact of Hurricane Sandy in the fourth quarter of 2012. In 2012 , we generated pre-tax earnings of $174.6 million
and net earnings of
$108.5 million on operating revenues of $1,318.4 million . For 2011 , we generated pre-tax earnings of $122.8 million and net earnings of $76.4 million on operating
revenues of 1,071.2 million and achieved a 13.5% operating margin. Cash and cash equivalents increased by 73.5 million in 2012 compared to the prior year, and as of
December 31, 2012 , we had cash and cash equivalents of $416.8 million .
The increase in operating income in 2012 over 2011 of $29.6 million , or 20.5% , is mainly due to a 23.1% increase in revenue partially offset by increased fuel and
other expenses. Revenue increase d year over year as a result of a 21.3% increase in capacity and a 1.9% improvement in average yield. Fuel costs increase d by $83.7
million during 2012 compared to 2011 , primarily driven by an 18.1% increase in consumption. Operating expenses increase d primarily due to our growth in capacity
resulting from the addition of eight aircraft to our fleet and our route network expansion.
In 2011, we improved our liquidity position with the completion of an IPO in June, whereby we retained $150.0 million of net proceeds, after paying off debt, fees and
costs associated with the offering. We recorded operating income in 2011 of $144.4 million on $1,071.2 million of operating revenues. Capacity growth and increased load
factor in 2011 drove the increase in revenue over 2010 and was partially offset by increased fuel prices and increases in various other operating costs.
Net income for 2010 of $72.5 million includes a $52.3 million net tax benefit primarily due to the release of a valuation allowance resulting in a deferred tax benefit of
$52.8 million in 2010. Absent the release of the valuation allowance and corresponding tax benefit, our net income would have been $19.7 million for 2010. In 2010, we
recorded operating income of $68.9 million on $781.3 million of operating revenues. The results of operations for 2010 were adversely affected by an increase in fuel prices
and the effects of our June 2010 pilot strike.
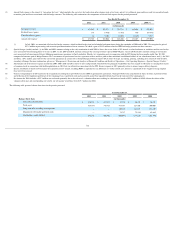
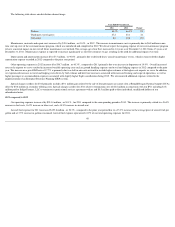
Operating Revenue
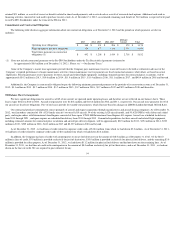
Non-ticket revenues comprise 40.6% of our total revenue for fiscal 2012 due to the effect of unbundling our fares and the introduction of new services beyond the sale
of a ticket for transportation.
2012 compared to 2011
Operating revenue increase d by $247.2 million , or 23.1% , to $1,318.4 million in 2012 compared to the prior year period as we increase d traffic by 20.7% and
improved our yield by 1.9% to 13.64 cent s.
Our results for the year ended December 31, 2012 were driven by growing capacity 21.3% compared to the prior year period while maintaining a high load factor of
85.2% and a network reorientation in mid-2011 that added capacity in Dallas-Fort Worth, Chicago and Las Vegas. In October 2012, we canceled 136 flights, or 19.9 million
available seat miles, as a result of adverse weather conditions and airport closures in connection with Hurricane Sandy. The negative impact of the storm on 2012 revenue
was approximately $25 million. We generated greater demand in 2012 by lowering our average ticket revenue per passenger flight segment to $75.11 , or by 7.2%
compared
to the prior year period, while increasing our non-ticket revenue per passenger flight segment from $44.79 to $51.39 , a 14.7% increase compared to the prior year period.
Total revenue per passenger flight segment increase d 0.6% from $125.76 in 2011 to $126.50 in 2012 .
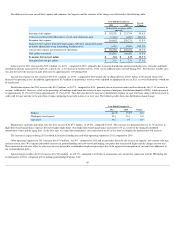
We experienced a 40.4% increase in non-ticket revenues in 2012 compared to 2011
, reflecting the continued development and optimization of ancillary revenues and a
22.4% increase in passenger flight segments. During the fourth quarter of 2011 and continuing into 2012, we further standardized our passenger usage fee across all markets
and fare classes, which drove much of the increases in non-ticket revenue in 2012 compared to 2011 . Non-ticket revenue represented 40.6% of total revenue in the year
ended December 31, 2012 compared to 35.6% in the same period of 2011 .
44
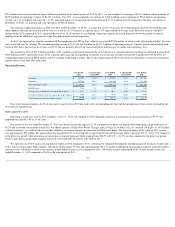
Year Ended
2012
% change 2012
versus 2011
Year Ended
2011
% change 2011
versus 2010
Year Ended
2010
Passenger
$
782,792
13.5%
$
689,650
28.2%
$
537,969
Non-ticket
535,596
40.4%
381,536
56.8%
243,296
Total operating revenue
$
1,318,388
23.1%
$
1,071,186
37.1%
$
781,265
RASM (cents)
11.62
1.5%
11.45
19.1%
9.62
Average ticket revenue per passenger flight segment
$
75.11
(7.2)%
$
80.97
4.6%
$
77.39
Average non-ticket revenue per passenger flight segment
$
51.39
14.7%
$
44.79
28.0%
35.00
Total revenue per passenger flight segment
$
126.50
0.6%
$
125.76
11.9%
$
112.39