Spirit Airlines 2012 Annual Report Download - page 37
Download and view the complete annual report
Please find page 37 of the 2012 Spirit Airlines annual report below. You can navigate through the pages in the report by either clicking on the pages listed below, or by using the keyword search tool below to find specific information within the annual report.-
 1
1 -
2
-
3
-
4
-
5
-
6
-
7
-
8
-
9
-
10
-
11
-
12
-
13
-
14
-
15
-
16
-
17
-
18
-
19
-
20
-
21
-
22
-
23
-
24
-
25
-
26
-
 27
27 -
 28
28 -
 29
29 -
 30
30 -
 31
31 -
 32
32 -
 33
33 -
 34
34 -
 35
35 -
 36
36 -
 37
37 -
 38
38 -
 39
39 -
 40
40 -
 41
41 -
 42
42 -
 43
43 -
 44
44 -
 45
45 -
 46
46 -
 47
47 -
48
-
49
-
50
-
51
-
52
-
53
-
54
-
55
-
56
-
57
-
58
-
59
-
60
-
61
-
62
-
63
-
64
-
65
-
66
-
67
-
68
-
69
-
70
-
71
-
72
-
73
-
74
-
75
-
76
-
77
-
78
-
79
-
80
-
81
-
82
-
83
-
84
-
85
-
86
-
87
-
88
-
89
-
90
-
91
-
92
-
93
-
94
-
95
-
96
-
97
-
98
-
99
-
100
-
101
-
102
 |
 |

ITEM 7. MANAGEMENT’S DISCUSSION AND ANALYSIS OF FINANCIAL CONDITION AND RESULTS OF OPERATIONS
You should read the following discussion of our financial condition and results of operations in conjunction with the financial statements and the notes thereto
included elsewhere in this annual report.
2012 Year in Review
The year 2012 proved to be one of the most successful years on record for the Company. We reported profitability for the sixth consecutive year, earning $108.5
million ( $1.49 per share, diluted), compared to net income of $76.4 million ( $1.43 per share, diluted) in 2011. Our continuous effort to preserve our low cost structure and
to offer separately a range of optional services allowed us to offer low base fares which drove strong customer demand during 2012. In addition, our ability to adjust our
capacity and routes in response to changing market conditions allowed us to increase our profitability year over year.
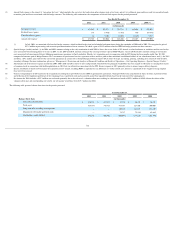
We achieved a 13.2% operating profit margin on $1.3 billion in operating revenues, despite an estimated $25 million in lost revenues caused by operational
disruptions related to Hurricane Sandy. Our traffic grew by 20.7% as we continued to stimulate demand with low fares, evidenced by our ability to reduce our average ticket
revenue per passenger flight segment by $5.86 or 7.2% to $75.11 . In addition to the effect of the storm during 2012, we also experienced increases in energy prices as well
as additional maintenance costs as a result of our seat maintenance program. Our fuel expense increased $83.7 million , or 21.6% , to $471.8 million during 2012 as
compared to 2011 mainly as a result of our increased flight volume of 19.9% coupled with increases in fuel cost per gallon of 3.8% year over year. During 2012, we
introduced and completed a new seat maintenance program which added $6.8 million in one-time start-up costs to maintenance expenses.
Our operating cost structure has been a primary area of focus since 2007, when we decided to compete solely on the basis of fare price and implemented our ULCC
business model. Spirit's unit operating costs continue to be among the lowest of any airline in the Americas. During 2012, we expanded our fleet of Airbus single-aisle
aircraft from 37 to 45 . Our high-density seating configuration allows us to be the "greenest" major airline in the United States, because we burn less fuel per passenger than
our competitors. We grew our capacity in 2012 by 21.3% , expanding into five new destinations - Phoenix/Mesa, Arizona; Denver, Colorado; Houston, Texas;
Minneapolis/St. Paul, Minnesota; and Los Cabos, Mexico. In 2012, we announced the opening of crew and maintenance bases in Las Vegas, Nevada and in Dallas/Fort
Worth, Texas to help support the expansion of our operation to destinations in the Western United States, and drive overall lower operating costs.
Driving increased ancillary revenue also continues to be a primary focus. In 2012, we increased our average non-ticket revenue per passenger flight segment by
14.7% , or $6.60 , to $51.39 . Our total non-ticket revenue increased by 40.4% , or $154.1 million , to $535.6 million in 2012. In late 2011, we increased our domestic
passenger usage fee, while decreasing many of the corresponding base fares, which drove much of the increase in non-
ticket revenue per passenger segment and the decrease
in ticket revenue per passenger segment in 2012. In addition, we restructured our bag charges in an effort to encourage customers to pre-pay for bags on the website rather
than at the airport or the gate. We also continued to grow non-ticket revenues by offering travel-related options such as hotels and rental cars for sale through our website,
through our $9 Fare Club, and other options to enhance our customers' travel experience.
During 2012, our unit operating costs excluding fuel and special charges (credits) (Adjusted CASM excluding fuel) increased by 4.9% to 6.00 cent s. The increase
on a per-unit basis is primarily due to increases in maintenance costs, depreciation and amortization, and certain costs within other operating expenses. The increase in
maintenance costs is due primarily to the one-time start-up costs of our seat maintenance program. The increase in depreciation and amortization is related to the increase in
scheduled heavy maintenance events on our aircraft. We use the deferral method of accounting for scheduled heavy maintenance checks, and therefore, once the event is
performed, we capitalize the associated costs and amortize the expense over time until the earlier of the end of the remaining lease term or until the next scheduled heavy
maintenance event. Many of the markets we added in 2012, as well as the run-rate effect of those added during 2011, have higher average operating costs which, in addition
to contributing to increases in other rents and landing fees, drove increases in station-related costs that are accounted for under other operating expenses. In addition, prior to
our crew base openings in Las Vegas, Nevada and Dallas, Texas in 2012, our network scope changes drove higher crew-related expenses as result of increased hotel
volumes at higher average rates. We also experienced higher passenger re-accommodation expenses associated with flight cancellations during 2012.
On December 2011, we signed a new agreement with Airbus for the delivery of 75 Airbus A320 aircraft. As of December 31, 2012, our firm order with Airbus
(including under our old purchase agreement) and a third party consisted of 106 A320 family aircraft scheduled for delivery through 2021. Our plan calls for growing the
fleet by 21.5% in 2013.
36