Spirit Airlines 2012 Annual Report Download - page 48
Download and view the complete annual report
Please find page 48 of the 2012 Spirit Airlines annual report below. You can navigate through the pages in the report by either clicking on the pages listed below, or by using the keyword search tool below to find specific information within the annual report.-
 1
1 -
2
-
3
-
4
-
5
-
6
-
7
-
8
-
9
-
10
-
11
-
12
-
13
-
14
-
15
-
16
-
17
-
18
-
19
-
20
-
21
-
22
-
23
-
24
-
25
-
26
-
27
-
28
-
29
-
30
-
31
-
32
-
33
-
34
-
35
-
36
-
37
-
 38
38 -
 39
39 -
 40
40 -
 41
41 -
 42
42 -
 43
43 -
 44
44 -
 45
45 -
 46
46 -
 47
47 -
 48
48 -
 49
49 -
 50
50 -
 51
51 -
 52
52 -
 53
53 -
 54
54 -
 55
55 -
 56
56 -
 57
57 -
 58
58 -
59
-
60
-
61
-
62
-
63
-
64
-
65
-
66
-
67
-
68
-
69
-
70
-
71
-
72
-
73
-
74
-
75
-
76
-
77
-
78
-
79
-
80
-
81
-
82
-
83
-
84
-
85
-
86
-
87
-
88
-
89
-
90
-
91
-
92
-
93
-
94
-
95
-
96
-
97
-
98
-
99
-
100
-
101
-
102
 |
 |

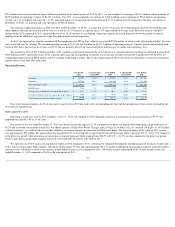
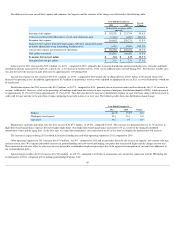
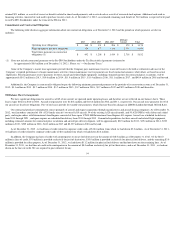
Aircraft fuel expense increase d from $388.0 million in 2011 to $471.8 million in 2012 , representing 41.2% of our total operating expenses for that 2012 period. The
increase was primarily due to an 18.1% increase in fuel gallons consumed as well as a 3.8% increase in fuel prices.
The difference between aircraft fuel expense and economic fuel expense and the elements of the changes are illustrated in the following table:
Fuel gallons consumed increase d 18.1% as a result of increased operations, as evidenced by an 18.8% increase in block hours. Our average daily aircraft utilization in
2012 increase d slightly compared to the prior year period. We estimate the fuel savings related to the 136 flights cancellations due to Hurricane Sandy were approximately
$0.6 million.
Total net loss recognized for hedges that settled during 2012 was $0.2 million , compared to a net gain of $7.4 million in the prior year period. These amounts
represent the net cash paid (received) for the settlement of hedges.
Labor costs in 2012 increase d by $37.2 million , or 20.5% , compared to 2011, primarily driven by a 22.4% increase in our pilot and flight attendant workforce as we
increase d our fleet size by 21.6% , or eight aircraft, during 2012 . During 2012 , we incurred an incremental $3.8 million of share-based compensation recorded within
salaries, wages and benefits, driven primarily by the commencement of the Performance Share Awards program in 2012.
During 2012 , aircraft rent increase d $27.1 million , or 23.3% , mainly due to the delivery of eight Airbus A320 aircraft subsequent to the fourth quarter of 2011. All
aircraft were financed through operating leases. The increase of aircraft rent expense on a per-ASM basis is primarily due to the fact that we incurred $2.5 million of
additional aircraft rent during 2012 related to a short-term lease agreement with a third-party provider (wet-leased aircraft) to maintain desired capacity during the summer
months.
Landing fees and other rents for 2012 increase d by $15.6 million , or 29.5% , compared to 2011 primarily due to a 19.9% increase in departures. On a per-ASM
basis, the increase in landing fees and other rents of 7.1% during 2012 as compared to the prior year period is due to increased volume at higher-cost airports, including
the addition of six new airports served in 2012 , which on average are higher-cost airports than the system average.
The increase in distribution expense of $5.3 million , or 10.4% , in 2012 compared to 2011 was primarily due to increased volume and an increase of approximately
4.1 percentage points year-over-year in the percentage of sales from third-party travel agents, which are more expensive than sales directly through our website. This shift in
distribution mix did not materially affect operating income because the revenues received from sales through third-party travel agents are designed to at least offset the
associated incremental costs. The decrease on a per-unit basis is primarily due to a decrease of approximately 14% in credit card fee rates period over period.
47
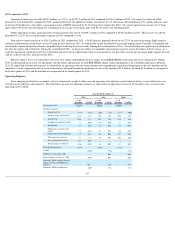
Year Ended December 31,
Percent
Change
2012
2011
(in thousands, except per-gallon
amounts)
Into-plane fuel expense
$
471,542
$
392,278
20.2
%
Cash received from settled derivatives, net of cash settlements paid
175
(7,436
)
(102.4
)%
Economic fuel expense
471,717
384,842
22.6
%
Impact on fuel expense from unrealized (gains) and losses arising from mark-
to-market adjustments to our outstanding fuel derivatives
46
3,204
(98.6
)%
Aircraft fuel expense (per Statement of Operations)
$
471,763
$
388,046
21.6
%
Fuel gallons consumed
142,991
121,030
18.1
%
Economic fuel cost per gallon
$
3.30
$
3.18
3.8
%
Into-plane fuel cost per gallon
$
3.30
$
3.24
1.9
%