Spirit Airlines 2012 Annual Report Download - page 50
Download and view the complete annual report
Please find page 50 of the 2012 Spirit Airlines annual report below. You can navigate through the pages in the report by either clicking on the pages listed below, or by using the keyword search tool below to find specific information within the annual report.-
 1
1 -
2
-
3
-
4
-
5
-
6
-
7
-
8
-
9
-
10
-
11
-
12
-
13
-
14
-
15
-
16
-
17
-
18
-
19
-
20
-
21
-
22
-
23
-
24
-
25
-
26
-
27
-
28
-
29
-
30
-
31
-
32
-
33
-
34
-
35
-
36
-
37
-
38
-
39
-
 40
40 -
 41
41 -
 42
42 -
 43
43 -
 44
44 -
 45
45 -
 46
46 -
 47
47 -
 48
48 -
 49
49 -
 50
50 -
 51
51 -
 52
52 -
 53
53 -
 54
54 -
 55
55 -
 56
56 -
 57
57 -
 58
58 -
 59
59 -
 60
60 -
61
-
62
-
63
-
64
-
65
-
66
-
67
-
68
-
69
-
70
-
71
-
72
-
73
-
74
-
75
-
76
-
77
-
78
-
79
-
80
-
81
-
82
-
83
-
84
-
85
-
86
-
87
-
88
-
89
-
90
-
91
-
92
-
93
-
94
-
95
-
96
-
97
-
98
-
99
-
100
-
101
-
102
 |
 |

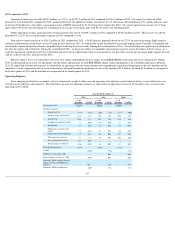
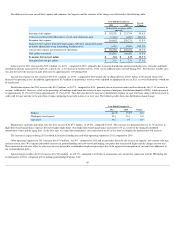
The difference between aircraft fuel expense and economic fuel expense and the elements of the changes are illustrated in the following table:
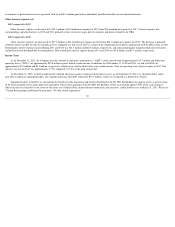
Labor costs for 2011 increase d by $25.3 million , or 16.2% , compared to 2010 , primarily due to increased headcount and increased pilot rates. Our pilot and flight
attendant headcount increased 10% and 16%, respectively, as we increase d our fleet size by 15.6% via the addition of five aircraft during 2011 . The increase in labor costs
was also driven by the increase in pilot labor rates by approximately 11% during 2011 .
Aircraft rent expense for 2011 increase d by $15.1 million , or 14.9% , compared to 2010 mainly due to taking delivery of five Airbus A320 aircraft which were
financed via operating leases. In addition, approximately $1.5 million in maintenance reserves were expensed as supplemental rent in 2011 as it was deemed they would not
be reimbursed.
Distribution expense for 2011 increase d by $10.2 million , or 24.7% , compared to 2010 , primarily due to increased credit card fees driven by the 37.1% increase in
revenue. Additionally, there was a shift in the percentage of bookings made from our website to more expensive third-party distribution channels (GDSs), which increase d
to approximately 23.1% in 2011 from approximately 15.1% in 2010 . This shift also drove the increase in distribution expense on a per unit basis, along with the increase in
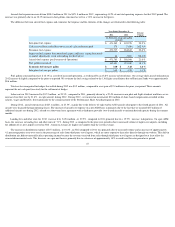
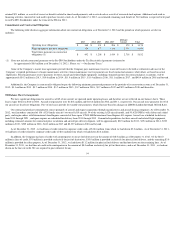
credit card fees per unit due to the growth in revenues outpacing the growth in units year over year. The following table shows our distribution channel usage:
Maintenance, materials and repair costs for 2011 increase d by $7.0 million , or 25.8% , compared to 2010 . This increase was primarily due to a 31.7% increase in
flight-hour-based maintenance expenses driven by higher flight hours. Non-flight-hour based maintenance increased 16.3% as a result of the timing of scheduled
maintenance events and the aging fleet. As the fleet ages, we expect that maintenance costs and related out of service time to complete the maintenance will increase.
The increase in capacity during 2011 resulted in increase d landing fees and other operating expenses in 2011 compared to 2010 .
Other operating expenses for 2011 increase d by $7.4 million , or 8.9% , compared to 2010 and are generally driven by the increase in capacity, new stations start-ups,
and increases in rates. We experienced notable increases in ground handling and crew travel and lodging cost partly due to increased flights and the changes in route mix.
These increases in cost were offset by a decrease in costs incurred to accommodate displaced passengers due to the aggressive management of cost and strict adherence to
our accommodation policy.
Special charges (credits) for 2011 increase d by $2.6 million , or 412.7% , compared to 2010 due to termination costs incurred in connection with the IPO during the
second quarter of 2011, comprised of $1.8 million paid to Indigo Partners, LLC
49
Year Ended December 31,
Percent
Change
2011
2010
(in thousands, except per-gallon
amounts)
Into-plane fuel expense
$
392,278
$
251,754
55.8
%
Cash received from settled derivatives, net of cash settlements paid
(7,436
)
(1,483
)
401.4
%
Economic fuel expense
384,842
250,271
53.8
%
Impact on fuel expense from unrealized (gains) and losses arising from mark-
to-market adjustments to our outstanding fuel derivatives
3,204
(2,065
)
(255.2
)%
Aircraft fuel expense (per Statement of Operations)
$
388,046
$
248,206
56.3
%
Fuel gallons consumed
121,030
106,628
13.5
%
Economic fuel cost per gallon
$
3.18
$
2.35
35.3
%
Into-plane fuel cost per gallon
$
3.24
$
2.36
37.3
%
Year Ended December 31,
2011
2010
Change
Website
66.3
%
75.2
%
(8.9
)
Third-party travel agents
23.1
15.1
8.0
Call center
10.6
9.7
0.9