Spirit Airlines 2012 Annual Report Download - page 47
Download and view the complete annual report
Please find page 47 of the 2012 Spirit Airlines annual report below. You can navigate through the pages in the report by either clicking on the pages listed below, or by using the keyword search tool below to find specific information within the annual report.-
 1
1 -
2
-
3
-
4
-
5
-
6
-
7
-
8
-
9
-
10
-
11
-
12
-
13
-
14
-
15
-
16
-
17
-
18
-
19
-
20
-
21
-
22
-
23
-
24
-
25
-
26
-
27
-
28
-
29
-
30
-
31
-
32
-
33
-
34
-
35
-
36
-
 37
37 -
 38
38 -
 39
39 -
 40
40 -
 41
41 -
 42
42 -
 43
43 -
 44
44 -
 45
45 -
 46
46 -
 47
47 -
 48
48 -
 49
49 -
 50
50 -
 51
51 -
 52
52 -
 53
53 -
 54
54 -
 55
55 -
 56
56 -
 57
57 -
58
-
59
-
60
-
61
-
62
-
63
-
64
-
65
-
66
-
67
-
68
-
69
-
70
-
71
-
72
-
73
-
74
-
75
-
76
-
77
-
78
-
79
-
80
-
81
-
82
-
83
-
84
-
85
-
86
-
87
-
88
-
89
-
90
-
91
-
92
-
93
-
94
-
95
-
96
-
97
-
98
-
99
-
100
-
101
-
102
 |
 |

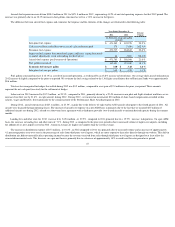
2012 compared to 2011
Operating expense increased by $217.6 million for 2012
compared to the prior year period mostly due to increases in fuel and labor costs, which were primarily driven
by our 21.3% capacity growth, in addition to increases in other operating costs.
Our adjusted CASM ex fuel for 2012 increased by 4.9% as compared to the same period in 2011. During 2012 , we incurred higher other operating expenses driven
by higher costs associated with passenger re-accommodations related to slightly higher flight cancellations. Additionally, overall increased rates at the airports resulted in
increased variable operating costs such as ground handling expenses and travel and lodging expense. During 2012, we also incurred an increase in maintenance costs related
to our seat maintenance program and an increase in deferred heavy aircraft maintenance events, which in turn resulted in higher heavy maintenance amortization expense.
Our average stage length for 2012 decrease d by 1.3% , contributing to the year-over-year increase in adjusted CASM ex fuel.
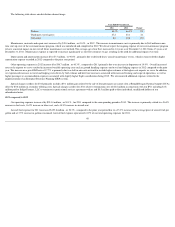
Aircraft fuel expenses includes both into-plane expense (as defined below) plus the effect of mark-to-market adjustments to our portfolio of derivative instruments,
which is a component of aircraft fuel expenses. Into-plane fuel expense is defined as the price that we generally pay at the airport, or the “into-plane” price, including taxes
and fees. Into-plane fuel prices are affected by world oil prices and refining costs, which can vary by region in the United States and the other countries where we operate.
Both fuel consumption and prices increased during 2012. Into-plane fuel expense approximates cash paid to the supplier and does not reflect the effect of our fuel
derivatives. Because our fuel derivative contracts do not qualify for hedge accounting, we recognize both realized and unrealized changes in the fair value of our derivatives
when they occur as a component of aircraft fuel expense.
We evaluate economic fuel expense , which we define as into-plane fuel expense excluding the cash we receive from or pay to counterparties for hedges that we settle
during the relevant period, including hedges that we terminate early during the period. The key difference between aircraft fuel expense and economic fuel expense is the
timing of gain or loss recognition on our hedge portfolio. When we refer to economic fuel expense, we include net settlement gains or losses only when they are realized
through a cash payment from our derivative contract counterparties for those contracts that were settled during the period. We believe this is the best measure of the effect
that fuel prices are currently having on our business because it most closely approximates the net cash outflow associated with purchasing fuel for our operations.
Accordingly, many industry analysts also evaluate airline results using this measure, and it is frequently used in our internal management reporting.
46
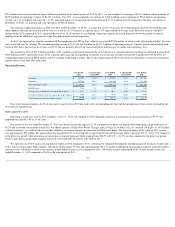
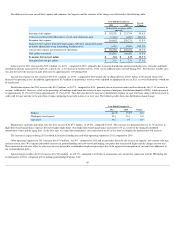
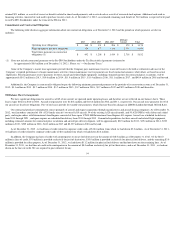
(1) Aircraft fuel expense is the sum of (i) “into-plane fuel cost,” which includes the cost of jet fuel and certain other charges such as fuel taxes and oil, (ii) settlement
gains and losses, and (iii) unrealized mark-to-market gains and losses associated with fuel hedge contracts. The following table summarizes the components of
aircraft fuel expense for the periods presented:
Year Ended December 31,
2012
2011
2010
(in thousands)
Into-plane fuel cost
$
471,542
$
392,278
$
251,754
Settlement losses (gains)
175
(7,436
)
(1,483
)
Unrealized mark-to-market losses
(gains)
46
3,204
(2,065
)
Aircraft fuel
$
471,763
$
388,046
$
248,206
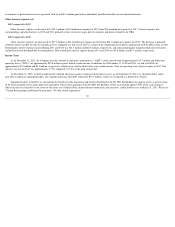
(2) Includes special charges (credits) of $(8.5) million ( (0.07) cent s per ASM) in 2012 , $3.2 million ( 0.03 cent s per ASM) in 2011 and $0.6 million (less than 0.01
cents per ASM) in 2010. Special charges (credits) for 2012 primarily include a $9.1 million gain related to the sale of four permanent air carrier slots at Ronald
Reagan National Airport (DCA), offset by $0.6 million in secondary offering costs. Special charges (credits) for 2011 include $2.3 million of termination costs in
connection with the IPO comprised of amounts paid to Indigo Partners, LLC to terminate its professional services agreement with us and fees paid to three
individual, unaffiliated holders of our subordinated notes and in the fourth quarter include legal, accounting, printing, and filing fees connected with the secondary
offering which was consummated on January 25, 2012. Special charges (credits) for 2010 include exit facility costs associated with amounts relating to the sale of
previously-expensed MD-80 parts and exit facility costs associated with moving our Detroit, Michigan maintenance activities to Fort Lauderdale, Florida. Please
see “—Our Operating Expenses—Special Charges (Credits).”