Salesforce.com 2016 Annual Report Download - page 98
Download and view the complete annual report
Please find page 98 of the 2016 Salesforce.com annual report below. You can navigate through the pages in the report by either clicking on the pages listed below, or by using the keyword search tool below to find specific information within the annual report.-
 1
1 -
2
-
3
-
4
-
5
-
6
-
7
-
8
-
9
-
10
-
11
-
12
-
13
-
14
-
15
-
16
-
17
-
18
-
19
-
20
-
21
-
22
-
23
-
24
-
25
-
26
-
27
-
28
-
29
-
30
-
31
-
32
-
33
-
34
-
35
-
36
-
37
-
38
-
39
-
40
-
41
-
42
-
43
-
44
-
45
-
46
-
47
-
48
-
49
-
50
-
51
-
52
-
53
-
54
-
55
-
56
-
57
-
58
-
59
-
60
-
61
-
62
-
63
-
64
-
65
-
66
-
67
-
68
-
69
-
70
-
71
-
72
-
73
-
74
-
75
-
76
-
77
-
78
-
79
-
80
-
81
-
82
-
83
-
84
-
85
-
86
-
87
-
 88
88 -
 89
89 -
 90
90 -
 91
91 -
 92
92 -
 93
93 -
 94
94 -
 95
95 -
 96
96 -
 97
97 -
 98
98 -
 99
99 -
 100
100 -
 101
101 -
 102
102 -
 103
103 -
 104
104 -
 105
105 -
 106
106 -
 107
107 -
 108
108 -
109
-
110
-
111
-
112
-
113
-
114
-
115
-
116
-
117
-
118
-
119
-
120
-
121
-
122
-
123
-
124
-
125
-
126
-
127
-
128
-
129
-
130
-
131
-
132
-
133
-
134
-
135
-
136
-
137
-
138
 |
 |

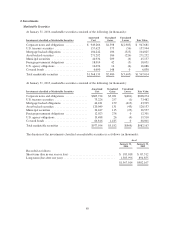
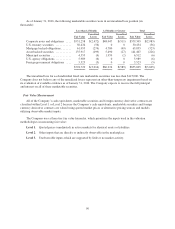
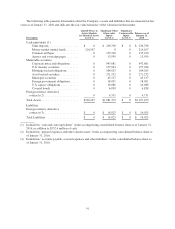
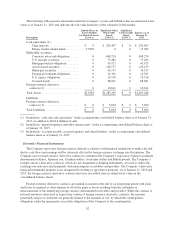
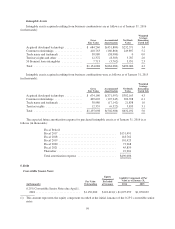
The following table presents information about the Company’s assets and liabilities that are measured at fair
value as of January 31, 2016 and indicates the fair value hierarchy of the valuation (in thousands):
Description
Quoted Prices in
Active Markets
for Identical Assets
(Level 1)
Significant Other
Observable
Inputs
(Level 2)
Significant
Unobservable
Inputs
(Level 3)
Balances as of
January 31,
2016
Cash equivalents (1):
Time deposits ................... $ 0 $ 236,798 $ 0 $ 236,798
Money market mutual funds ........ 216,107 0 0 216,107
Commercial Paper ................ 0 159,230 0 159,230
Agency and sovereign paper ........ 0 13,599 0 13,599
Marketable securities:
Corporate notes and obligations ..... 0 947,681 0 947,681
U.S. treasury securities ............ 0 157,944 0 157,944
Mortgage backed obligations ....... 0 104,025 0 104,025
Asset backed securities ............ 0 271,252 0 271,252
Municipal securities .............. 0 45,137 0 45,137
Foreign government obligations ..... 0 18,051 0 18,051
U.S. agency obligations ............ 0 16,086 0 16,086
Covered bonds ................... 0 6,838 0 6,838
Foreign currency derivative
contracts (2) ....................... 0 4,731 0 4,731
Total Assets ......................... $216,107 $1,981,372 $ 0 $2,197,479
Liabilities
Foreign currency derivative
contracts (3) ....................... $ 0 $ 14,025 $ 0 $ 14,025
Total Liabilities ...................... $ 0 $ 14,025 $ 0 $ 14,025
(1) Included in “cash and cash equivalents” in the accompanying consolidated balance sheet as of January 31,
2016, in addition to $532.6 million of cash.
(2) Included in “prepaid expenses and other current assets” in the accompanying consolidated balance sheet as
of January 31, 2016.
(3) Included in “accounts payable, accrued expenses and other liabilities” in the consolidated balance sheet as
of January 31, 2016.
91