Salesforce.com 2016 Annual Report Download - page 83
Download and view the complete annual report
Please find page 83 of the 2016 Salesforce.com annual report below. You can navigate through the pages in the report by either clicking on the pages listed below, or by using the keyword search tool below to find specific information within the annual report.-
 1
1 -
2
-
3
-
4
-
5
-
6
-
7
-
8
-
9
-
10
-
11
-
12
-
13
-
14
-
15
-
16
-
17
-
18
-
19
-
20
-
21
-
22
-
23
-
24
-
25
-
26
-
27
-
28
-
29
-
30
-
31
-
32
-
33
-
34
-
35
-
36
-
37
-
38
-
39
-
40
-
41
-
42
-
43
-
44
-
45
-
46
-
47
-
48
-
49
-
50
-
51
-
52
-
53
-
54
-
55
-
56
-
57
-
58
-
59
-
60
-
61
-
62
-
63
-
64
-
65
-
66
-
67
-
68
-
69
-
70
-
71
-
72
-
 73
73 -
 74
74 -
 75
75 -
 76
76 -
 77
77 -
 78
78 -
 79
79 -
 80
80 -
 81
81 -
 82
82 -
 83
83 -
 84
84 -
 85
85 -
 86
86 -
 87
87 -
 88
88 -
 89
89 -
 90
90 -
 91
91 -
 92
92 -
 93
93 -
94
-
95
-
96
-
97
-
98
-
99
-
100
-
101
-
102
-
103
-
104
-
105
-
106
-
107
-
108
-
109
-
110
-
111
-
112
-
113
-
114
-
115
-
116
-
117
-
118
-
119
-
120
-
121
-
122
-
123
-
124
-
125
-
126
-
127
-
128
-
129
-
130
-
131
-
132
-
133
-
134
-
135
-
136
-
137
-
138
 |
 |

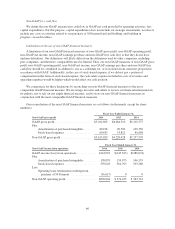
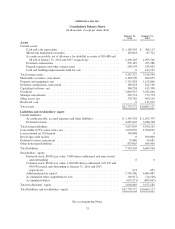
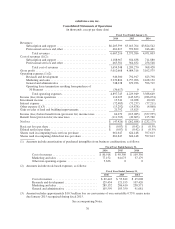
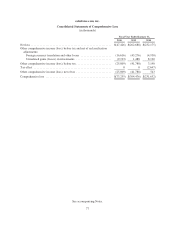
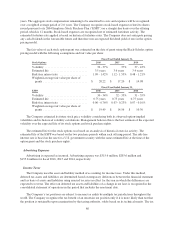
salesforce.com, inc.
Consolidated Statements of Operations
(in thousands, except per share data)
Fiscal Year Ended January 31,
2016 2015 2014
Revenues:
Subscription and support .................................. $6,205,599 $5,013,764 $3,824,542
Professional services and other ............................. 461,617 359,822 246,461
Total revenues ...................................... 6,667,216 5,373,586 4,071,003
Cost of revenues (1)(2):
Subscription and support .................................. 1,188,967 924,638 711,880
Professional services and other ............................. 465,581 364,632 256,548
Total cost of revenues ................................ 1,654,548 1,289,270 968,428
Gross profit ................................................ 5,012,668 4,084,316 3,102,575
Operating expenses (1)(2):
Research and development ................................ 946,300 792,917 623,798
Marketing and sales ...................................... 3,239,824 2,757,096 2,168,132
General and administrative ................................ 748,238 679,936 596,719
Operating lease termination resulting from purchase of
50 Fremont .......................................... (36,617) 0 0
Total operating expenses .............................. 4,897,745 4,229,949 3,388,649
Income (loss) from operations ................................. 114,923 (145,633) (286,074)
Investment income .......................................... 15,341 10,038 10,218
Interest expense ............................................. (72,485) (73,237) (77,211)
Other expense (1)(3) ......................................... (15,292) (19,878) (4,868)
Gain on sales of land and building improvements .................. 21,792 15,625 0
Income (loss) before benefit from (provision for) income taxes ....... 64,279 (213,085) (357,935)
Benefit from (provision for) income taxes ........................ (111,705) (49,603) 125,760
Net loss ................................................... $ (47,426) $ (262,688) $ (232,175)
Basic net loss per share ....................................... $ (0.07) $ (0.42) $ (0.39)
Diluted net loss per share ..................................... $ (0.07) $ (0.42) $ (0.39)
Shares used in computing basic net loss per share .................. 661,647 624,148 597,613
Shares used in computing diluted net loss per share ................. 661,647 624,148 597,613
(1) Amounts include amortization of purchased intangibles from business combinations, as follows:
Fiscal Year Ended January 31,
2016 2015 2014
Cost of revenues ............................. $ 80,918 $ 90,300 $ 109,356
Marketing and sales .......................... 77,152 64,673 37,179
Other non-operating expense ................... 3,636 0 0
(2) Amounts include stock-based expenses, as follows:
Fiscal Year Ended January 31,
2016 2015 2014
Cost of revenues .............................. $ 69,443 $ 53,812 $ 45,608
Research and development ...................... 129,434 121,193 107,420
Marketing and sales ........................... 289,152 286,410 258,571
General and administrative ..................... 105,599 103,350 91,681
(3) Amount includes approximately $10.3 million loss on conversions of our convertible 0.75% senior notes
due January 2015 recognized during fiscal 2015.
See accompanying Notes.
76