Salesforce.com 2016 Annual Report Download - page 123
Download and view the complete annual report
Please find page 123 of the 2016 Salesforce.com annual report below. You can navigate through the pages in the report by either clicking on the pages listed below, or by using the keyword search tool below to find specific information within the annual report.-
 1
1 -
2
-
3
-
4
-
5
-
6
-
7
-
8
-
9
-
10
-
11
-
12
-
13
-
14
-
15
-
16
-
17
-
18
-
19
-
20
-
21
-
22
-
23
-
24
-
25
-
26
-
27
-
28
-
29
-
30
-
31
-
32
-
33
-
34
-
35
-
36
-
37
-
38
-
39
-
40
-
41
-
42
-
43
-
44
-
45
-
46
-
47
-
48
-
49
-
50
-
51
-
52
-
53
-
54
-
55
-
56
-
57
-
58
-
59
-
60
-
61
-
62
-
63
-
64
-
65
-
66
-
67
-
68
-
69
-
70
-
71
-
72
-
73
-
74
-
75
-
76
-
77
-
78
-
79
-
80
-
81
-
82
-
83
-
84
-
85
-
86
-
87
-
88
-
89
-
90
-
91
-
92
-
93
-
94
-
95
-
96
-
97
-
98
-
99
-
100
-
101
-
102
-
103
-
104
-
105
-
106
-
107
-
108
-
109
-
110
-
111
-
112
-
 113
113 -
 114
114 -
 115
115 -
 116
116 -
 117
117 -
 118
118 -
 119
119 -
 120
120 -
 121
121 -
 122
122 -
 123
123 -
 124
124 -
 125
125 -
 126
126 -
 127
127 -
 128
128 -
 129
129 -
 130
130 -
 131
131 -
 132
132 -
 133
133 -
134
-
135
-
136
-
137
-
138
 |
 |

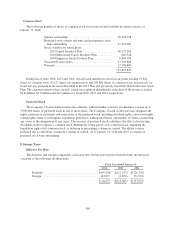
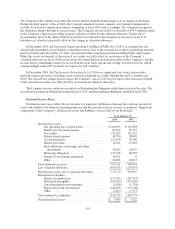
Additionally, the Company has donated subscriptions of the Company’s services to other qualified non-
profit organizations. The Company also allows Salesforce.org to resell the Company’s service to non-profit
organizations and certain higher education entities. The Company does not charge Salesforce.org for these
subscriptions, therefore revenue from subscriptions provided to non-profit organizations is donated back to the
community through charitable grants made by the Foundation and Salesforce.org. The reseller agreement was
amended in August 2015 to include additional customer segments and certain customers outside the U.S. and was
amended in October 2015 to add an addendum with model clauses for the processing of personal data transferred
from the European Economic Area. The value of the subscriptions pursuant to reseller agreements was
approximately $69.9 million for the fiscal year 2016. The Company plans to continue these programs.
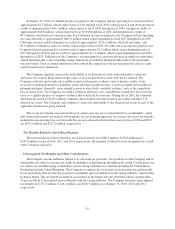
14. Subsequent Events
In February 2016, the Company acquired the outstanding stock of SteelBrick, Inc. (“SteelBrick”), a next
generation quote-to-cash platform, delivered 100 percent natively on the Salesforce platform, that offers apps for
automating the entire deal close process-from generating quotes and configuring orders to collecting cash. The
Company acquired SteelBrick for its employees and product offerings. Beginning with fiscal quarter ended
April 30, 2016, the Company will include the financial results of SteelBrick in its condensed consolidated
financial statements from the date of the acquisition. The total estimated consideration for SteelBrick was over
$300.0 million and primarily in shares.
In February 2016, the Company entered into an agreement to sublease additional office space. The amounts
associated with the agreement will be approximately $311.0 million over the approximately 12 year term of the
agreement, beginning in the Company’s first quarter of fiscal 2018.
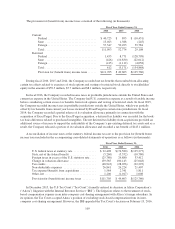
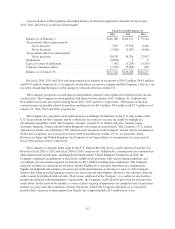
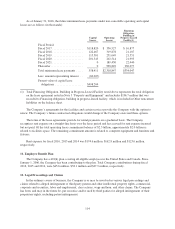
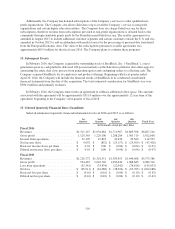
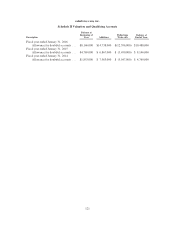
15. Selected Quarterly Financial Data (Unaudited)
Selected summarized quarterly financial information for fiscal 2016 and 2015 is as follows:
1st
Quarter
2nd
Quarter
3rd
Quarter
4th
Quarter Fiscal Year
(in thousands, except per share data)
Fiscal 2016
Revenues ............................ $1,511,167 $1,634,684 $1,711,967 $1,809,398 $6,667,216
Gross profit .......................... 1,129,365 1,229,300 1,288,284 1,365,719 5,012,668
Income from operations ................ 31,105 19,824 43,434 20,560 114,923
Net income (loss) ..................... $ 4,092 $ (852) $ (25,157) $ (25,509) $ (47,426)
Basic net income (loss) per share ......... $ 0.01 $ 0.00 $ (0.04) $ (0.04) $ (0.07)
Diluted net income (loss) per share ........ $ 0.01 $ 0.00 $ (0.04) $ (0.04) $ (0.07)
Fiscal 2015
Revenues ............................ $1,226,772 $1,318,551 $1,383,655 $1,444,608 $5,373,586
Gross profit .......................... 934,467 1,010,720 1,050,444 1,088,685 4,084,316
Loss from operations ................... (55,341) (33,434) (22,042) (34,816) (145,633)
Net loss ............................. $ (96,911) $ (61,088) $ (38,924) $ (65,765) $ (262,688)
Basic net loss per share ................. $ (0.16) $ (0.10) $ (0.06) $ (0.10) $ (0.42)
Diluted net loss per share ............... $ (0.16) $ (0.10) $ (0.06) $ (0.10) $ (0.42)
116