Salesforce.com 2016 Annual Report Download - page 43
Download and view the complete annual report
Please find page 43 of the 2016 Salesforce.com annual report below. You can navigate through the pages in the report by either clicking on the pages listed below, or by using the keyword search tool below to find specific information within the annual report.-
 1
1 -
2
-
3
-
4
-
5
-
6
-
7
-
8
-
9
-
10
-
11
-
12
-
13
-
14
-
15
-
16
-
17
-
18
-
19
-
20
-
21
-
22
-
23
-
24
-
25
-
26
-
27
-
28
-
29
-
30
-
31
-
32
-
 33
33 -
 34
34 -
 35
35 -
 36
36 -
 37
37 -
 38
38 -
 39
39 -
 40
40 -
 41
41 -
 42
42 -
 43
43 -
 44
44 -
 45
45 -
 46
46 -
 47
47 -
 48
48 -
 49
49 -
 50
50 -
 51
51 -
 52
52 -
 53
53 -
54
-
55
-
56
-
57
-
58
-
59
-
60
-
61
-
62
-
63
-
64
-
65
-
66
-
67
-
68
-
69
-
70
-
71
-
72
-
73
-
74
-
75
-
76
-
77
-
78
-
79
-
80
-
81
-
82
-
83
-
84
-
85
-
86
-
87
-
88
-
89
-
90
-
91
-
92
-
93
-
94
-
95
-
96
-
97
-
98
-
99
-
100
-
101
-
102
-
103
-
104
-
105
-
106
-
107
-
108
-
109
-
110
-
111
-
112
-
113
-
114
-
115
-
116
-
117
-
118
-
119
-
120
-
121
-
122
-
123
-
124
-
125
-
126
-
127
-
128
-
129
-
130
-
131
-
132
-
133
-
134
-
135
-
136
-
137
-
138
 |
 |

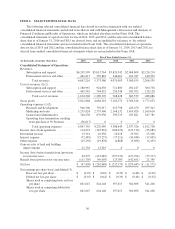
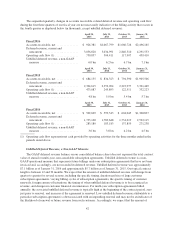
ITEM 6. SELECTED FINANCIAL DATA
The following selected consolidated financial data should be read in conjunction with our audited
consolidated financial statements and related notes thereto and with Management’s Discussion and Analysis of
Financial Condition and Results of Operations, which are included elsewhere in this Form 10-K. The
consolidated statement of operations data for fiscal 2016, 2015 and 2014, and the selected consolidated balance
sheet data as of January 31, 2016 and 2015 are derived from, and are qualified by reference to, the audited
consolidated financial statements and are included in this Form 10-K. The consolidated statement of operations
data for fiscal 2013 and 2012 and the consolidated balance sheet data as of January 31, 2014, 2013 and 2012 are
derived from audited consolidated financial statements which are not included in this Form 10-K.
Fiscal Year Ended January 31,
(in thousands, except per share data) 2016 2015 2014 2013 2012
Consolidated Statement of Operations
Revenues:
Subscription and support ............ $6,205,599 $5,013,764 $3,824,542 $2,868,808 $2,126,234
Professional services and other ....... 461,617 359,822 246,461 181,387 140,305
Total revenues ................ 6,667,216 5,373,586 4,071,003 3,050,195 2,266,539
Cost of revenues (1)(2):
Subscription and support ............ 1,188,967 924,638 711,880 494,187 360,758
Professional services and other ....... 465,581 364,632 256,548 189,392 128,128
Total cost of revenues .......... 1,654,548 1,289,270 968,428 683,579 488,886
Gross profit .......................... 5,012,668 4,084,316 3,102,575 2,366,616 1,777,653
Operating expenses (1)(2):
Research and development .......... 946,300 792,917 623,798 429,479 295,347
Marketing and sales ................ 3,239,824 2,757,096 2,168,132 1,614,026 1,169,610
General and administrative .......... 748,238 679,936 596,719 433,821 347,781
Operating lease termination resulting
from purchase of 50 Fremont ...... (36,617) 0000
Total operating expenses ........ 4,897,745 4,229,949 3,388,649 2,477,326 1,812,738
Income (loss) from operations ........... 114,923 (145,633) (286,074) (110,710) (35,085)
Investment income .................... 15,341 10,038 10,218 19,562 23,268
Interest expense ....................... (72,485) (73,237) (77,211) (30,948) (17,045)
Other expense ........................ (15,292) (19,878) (4,868) (5,698) (4,455)
Gain on sales of land and building
improvements ...................... 21,792 15,625000
Income (loss) before benefit from (provision
for) income taxes .................... 64,279 (213,085) (357,935) (127,794) (33,317)
Benefit from (provision for) income taxes . . (111,705) (49,603) 125,760 (142,651) 21,745
Net loss ............................. $ (47,426) $ (262,688) $ (232,175) $ (270,445) $ (11,572)
Net earnings per share-basic and diluted (3):
Basic net loss per share ............. $ (0.07) $ (0.42) $ (0.39) $ (0.48) $ (0.02)
Diluted net loss per share ........... $ (0.07) $ (0.42) $ (0.39) $ (0.48) $ (0.02)
Shares used in computing basic net loss
per share ...................... 661,647 624,148 597,613 564,896 541,208
Shares used in computing diluted net
loss per share ................... 661,647 624,148 597,613 564,896 541,208
36