Salesforce.com 2016 Annual Report Download - page 56
Download and view the complete annual report
Please find page 56 of the 2016 Salesforce.com annual report below. You can navigate through the pages in the report by either clicking on the pages listed below, or by using the keyword search tool below to find specific information within the annual report.-
 1
1 -
2
-
3
-
4
-
5
-
6
-
7
-
8
-
9
-
10
-
11
-
12
-
13
-
14
-
15
-
16
-
17
-
18
-
19
-
20
-
21
-
22
-
23
-
24
-
25
-
26
-
27
-
28
-
29
-
30
-
31
-
32
-
33
-
34
-
35
-
36
-
37
-
38
-
39
-
40
-
41
-
42
-
43
-
44
-
45
-
 46
46 -
 47
47 -
 48
48 -
 49
49 -
 50
50 -
 51
51 -
 52
52 -
 53
53 -
 54
54 -
 55
55 -
 56
56 -
 57
57 -
 58
58 -
 59
59 -
 60
60 -
 61
61 -
 62
62 -
 63
63 -
 64
64 -
 65
65 -
 66
66 -
67
-
68
-
69
-
70
-
71
-
72
-
73
-
74
-
75
-
76
-
77
-
78
-
79
-
80
-
81
-
82
-
83
-
84
-
85
-
86
-
87
-
88
-
89
-
90
-
91
-
92
-
93
-
94
-
95
-
96
-
97
-
98
-
99
-
100
-
101
-
102
-
103
-
104
-
105
-
106
-
107
-
108
-
109
-
110
-
111
-
112
-
113
-
114
-
115
-
116
-
117
-
118
-
119
-
120
-
121
-
122
-
123
-
124
-
125
-
126
-
127
-
128
-
129
-
130
-
131
-
132
-
133
-
134
-
135
-
136
-
137
-
138
 |
 |

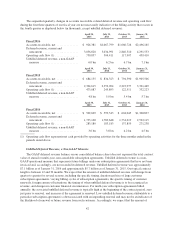
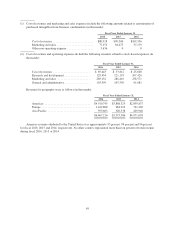
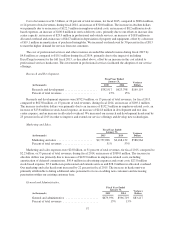
(1) Cost of revenues and marketing and sales expenses include the following amounts related to amortization of
purchased intangibles from business combinations (in thousands):
Fiscal Year Ended January 31,
2016 2015 2014
Cost of revenues ............................ $80,918 $90,300 $109,356
Marketing and sales ......................... 77,152 64,673 37,179
Other non-operating expense .................. 3,636 0 0
(2) Cost of revenues and operating expenses include the following amounts related to stock-based expenses (in
thousands):
Fiscal Year Ended January 31,
2016 2015 2014
Cost of revenues ......................... $ 69,443 $ 53,812 $ 45,608
Research and development ................. 129,434 121,193 107,420
Marketing and sales ...................... 289,152 286,410 258,571
General and administrative ................. 105,599 103,350 91,681
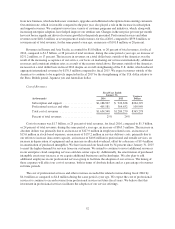
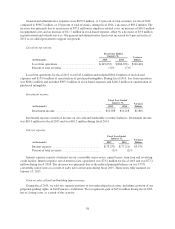
Revenues by geography were as follows (in thousands):
Fiscal Year Ended January 31,
2016 2015 2014
Americas ............................... $4,910,745 $3,868,329 $2,899,837
Europe ................................. 1,162,808 984,919 741,220
Asia Pacific ............................. 593,663 520,338 429,946
$6,667,216 $5,373,586 $4,071,003
Americas revenue attributed to the United States was approximately 95 percent, 94 percent and 96 percent
for fiscal 2016, 2015 and 2014, respectively. No other country represented more than ten percent of total revenue
during fiscal 2016, 2015 or 2014.
49