Salesforce.com 2016 Annual Report Download - page 59
Download and view the complete annual report
Please find page 59 of the 2016 Salesforce.com annual report below. You can navigate through the pages in the report by either clicking on the pages listed below, or by using the keyword search tool below to find specific information within the annual report.-
 1
1 -
2
-
3
-
4
-
5
-
6
-
7
-
8
-
9
-
10
-
11
-
12
-
13
-
14
-
15
-
16
-
17
-
18
-
19
-
20
-
21
-
22
-
23
-
24
-
25
-
26
-
27
-
28
-
29
-
30
-
31
-
32
-
33
-
34
-
35
-
36
-
37
-
38
-
39
-
40
-
41
-
42
-
43
-
44
-
45
-
46
-
47
-
48
-
 49
49 -
 50
50 -
 51
51 -
 52
52 -
 53
53 -
 54
54 -
 55
55 -
 56
56 -
 57
57 -
 58
58 -
 59
59 -
 60
60 -
 61
61 -
 62
62 -
 63
63 -
 64
64 -
 65
65 -
 66
66 -
 67
67 -
 68
68 -
 69
69 -
70
-
71
-
72
-
73
-
74
-
75
-
76
-
77
-
78
-
79
-
80
-
81
-
82
-
83
-
84
-
85
-
86
-
87
-
88
-
89
-
90
-
91
-
92
-
93
-
94
-
95
-
96
-
97
-
98
-
99
-
100
-
101
-
102
-
103
-
104
-
105
-
106
-
107
-
108
-
109
-
110
-
111
-
112
-
113
-
114
-
115
-
116
-
117
-
118
-
119
-
120
-
121
-
122
-
123
-
124
-
125
-
126
-
127
-
128
-
129
-
130
-
131
-
132
-
133
-
134
-
135
-
136
-
137
-
138
 |
 |

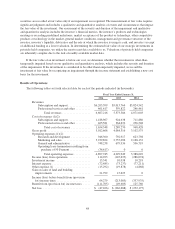
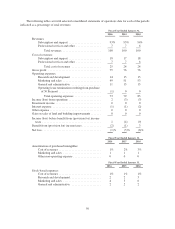
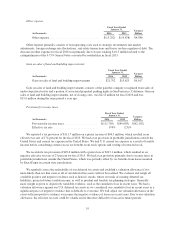
from new business, which includes new customers, upgrades and additional subscriptions from existing customers.
Our attrition rate, which is favorable compared to the prior year, also played a role in the increase in subscription
and support revenues. We continue to invest in a variety of customer programs and initiatives, which, along with
increasing enterprise adoption, have helped improve our attrition rate. Changes in the net price per user per month
have not been a significant driver of revenue growth for the periods presented. Professional services and other
revenues were $461.6 million, or seven percent of total revenues, for fiscal 2016, compared to $359.8 million, or
seven percent of total revenues, for the same period a year ago, an increase of $101.8 million, or 28 percent.
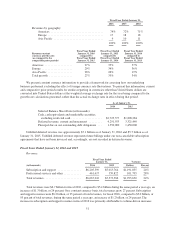
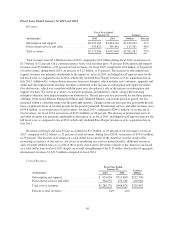
Revenues in Europe and Asia Pacific accounted for $1.8 billion, or 26 percent of total revenues, for fiscal
2016, compared to $1.5 billion, or 28 percent of total revenues, during the same period a year ago, an increase of
$251.2 million, or 17 percent. The increase in revenues on a total dollar basis outside of the Americas was the
result of the increasing acceptance of our service, our focus on marketing our services internationally, additional
resources and consistent attrition rates as a result of the reasons stated above. Revenues outside of the Americas
increased on a total dollar basis in fiscal 2016 despite an overall strengthening of the U.S. dollar, which reduced
aggregate international revenues by $170.5 million compared to fiscal 2015. We expect revenues outside of the
Americas to continue to be negatively impacted in fiscal 2017 by the strengthening of the U.S. dollar relative to
the Euro, British pound, Japanese yen and Australian dollar.
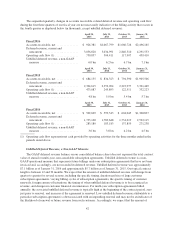
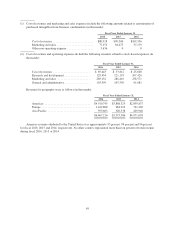
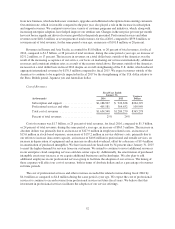
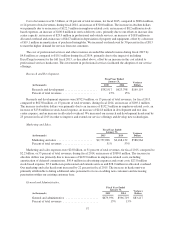
Cost of Revenues.
Fiscal Year Ended
January 31, Variance
Dollars(in thousands) 2016 2015
Subscription and support .................... $1,188,967 $ 924,638 $264,329
Professional services and other ............... 465,581 364,632 100,949
Total cost of revenues ...................... $1,654,548 $1,289,270 $365,278
Percent of total revenues .................... 25% 24%
Cost of revenues was $1.7 billion, or 25 percent of total revenues, for fiscal 2016, compared to $1.3 billion,
or 24 percent of total revenues, during the same period a year ago, an increase of $365.3 million. The increase in
absolute dollars was primarily due to an increase of $127.9 million in employee-related costs, an increase of
$15.6 million in stock-based expenses, an increase of $137.2 million in service delivery costs, primarily due to
our efforts to increase data center capacity, an increase of $40.6 million in professional and outside services, an
increase in depreciation of equipment and an increase in allocated overhead, offset by a decrease of $9.4 million
in amortization of purchased intangibles. We have increased our headcount by 34 percent since January 31, 2015
to meet the higher demand for services from our customers. We intend to continue to invest additional resources
in our enterprise cloud computing services and data center capacity. Additionally, the amortization of purchased
intangible assets may increase as we acquire additional businesses and technologies. We also plan to add
additional employees in our professional services group to facilitate the adoption of our services. The timing of
these expenses will affect our cost of revenues, both in terms of absolute dollars and as a percentage of revenues
in future periods.
The cost of professional services and other revenues exceeded the related revenue during fiscal 2016 by
$4.0 million as compared to $4.8 million during the same period a year ago. We expect the cost of professional
services to continue to exceed revenue from professional services in future fiscal years. We believe that this
investment in professional services facilitates the adoption of our service offerings.
52