Salesforce.com 2016 Annual Report Download - page 64
Download and view the complete annual report
Please find page 64 of the 2016 Salesforce.com annual report below. You can navigate through the pages in the report by either clicking on the pages listed below, or by using the keyword search tool below to find specific information within the annual report.-
 1
1 -
2
-
3
-
4
-
5
-
6
-
7
-
8
-
9
-
10
-
11
-
12
-
13
-
14
-
15
-
16
-
17
-
18
-
19
-
20
-
21
-
22
-
23
-
24
-
25
-
26
-
27
-
28
-
29
-
30
-
31
-
32
-
33
-
34
-
35
-
36
-
37
-
38
-
39
-
40
-
41
-
42
-
43
-
44
-
45
-
46
-
47
-
48
-
49
-
50
-
51
-
52
-
53
-
 54
54 -
 55
55 -
 56
56 -
 57
57 -
 58
58 -
 59
59 -
 60
60 -
 61
61 -
 62
62 -
 63
63 -
 64
64 -
 65
65 -
 66
66 -
 67
67 -
 68
68 -
 69
69 -
 70
70 -
 71
71 -
 72
72 -
 73
73 -
 74
74 -
75
-
76
-
77
-
78
-
79
-
80
-
81
-
82
-
83
-
84
-
85
-
86
-
87
-
88
-
89
-
90
-
91
-
92
-
93
-
94
-
95
-
96
-
97
-
98
-
99
-
100
-
101
-
102
-
103
-
104
-
105
-
106
-
107
-
108
-
109
-
110
-
111
-
112
-
113
-
114
-
115
-
116
-
117
-
118
-
119
-
120
-
121
-
122
-
123
-
124
-
125
-
126
-
127
-
128
-
129
-
130
-
131
-
132
-
133
-
134
-
135
-
136
-
137
-
138
 |
 |

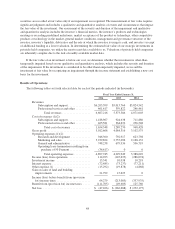
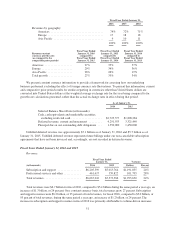
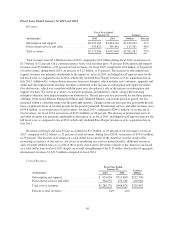
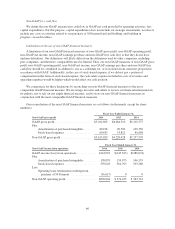
Cost of revenues was $1.3 billion, or 24 percent of total revenues, for fiscal 2015, compared to $968.4 million,
or 24 percent of total revenues, during fiscal 2014, an increase of $320.8 million. The increase in absolute dollars
was primarily due to an increase of $122.3 million in employee-related costs, an increase of $8.2 million in stock-
based expenses, an increase of $100.6 million in service delivery costs, primarily due to our efforts to increase data
center capacity, an increase of $29.9 million in professional and outside services, an increase of $18.8 million in
allocated overhead and an increase of $44.7 million in depreciation of property and equipment, offset by a decrease
of $19.1 million in amortization of purchased intangibles. We increased our headcount by 30 percent in fiscal 2015
to meet the higher demand for services from our customers.
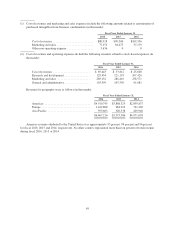
The cost of professional services and other revenues exceeded the related revenue during fiscal 2015 by
$4.8 million as compared to $10.1 million during fiscal 2014, primarily due to the impact of including
ExactTarget revenue for the full fiscal 2015, as described above, offset by an increase in the cost related to
professional services headcount. This investment in professional services facilitated the adoption of our service
offerings.
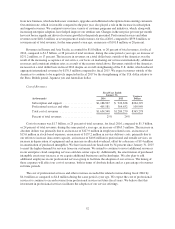
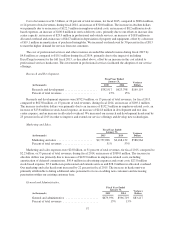
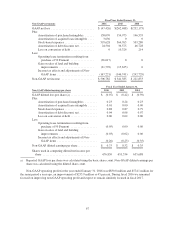
Research and Development.
Fiscal Year Ended
January 31, Variance
Dollars(in thousands) 2015 2014
Research and development ...................... $792,917 $623,798 $169,119
Percent of total revenues ....................... 15% 15%
Research and development expenses were $792.9 million, or 15 percent of total revenues, for fiscal 2015,
compared to $623.8 million, or 15 percent of total revenues, during fiscal 2014, an increase of $169.1 million.
The increase in absolute dollars was primarily due to an increase of $132.3 million in employee-related costs, an
increase of $13.8 million in stock-based expense, an increase of $14.8 million in development and test data
center expense, and an increase in allocated overhead. We increased our research and development headcount by
25 percent in fiscal 2015 in order to improve and extend our service offerings and develop new technologies.
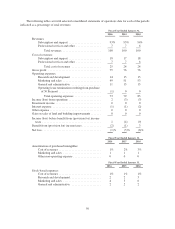
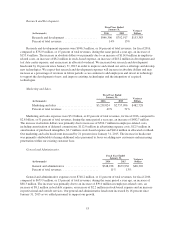
Marketing and Sales.
Fiscal Year Ended
January 31, Variance
Dollars(in thousands) 2015 2014
Marketing and sales ........................ $2,757,096 $2,168,132 $588,964
Percent of total revenues .................... 51% 53%
Marketing and sales expenses were $2.8 billion, or 51 percent of total revenues, for fiscal 2015, compared to
$2.2 billion, or 53 percent of total revenues, during fiscal 2014, an increase of $589.0 million. The increase in
absolute dollars was primarily due to increases of $439.0 million in employee-related costs, including
amortization of deferred commissions, $56.4 million in advertising expenses and event costs, $27.8 million
stock-based expense, $5.2 million in professional and outside services and $28.0 million in allocated overhead.
Our marketing and sales headcount increased by 22 percent in fiscal 2015. The increase in headcount was
primarily attributable to hiring additional sales personnel to focus on adding new customers and increasing
penetration within our existing customer base.
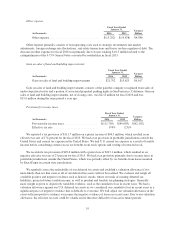
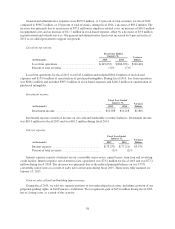
General and Administrative.
Fiscal Year Ended
January 31, Variance
Dollars(in thousands) 2015 2014
General and administrative ...................... $679,936 $596,719 $83,217
Percent of total revenues ........................ 13% 15%
57