Salesforce.com 2016 Annual Report Download - page 58
Download and view the complete annual report
Please find page 58 of the 2016 Salesforce.com annual report below. You can navigate through the pages in the report by either clicking on the pages listed below, or by using the keyword search tool below to find specific information within the annual report.-
 1
1 -
2
-
3
-
4
-
5
-
6
-
7
-
8
-
9
-
10
-
11
-
12
-
13
-
14
-
15
-
16
-
17
-
18
-
19
-
20
-
21
-
22
-
23
-
24
-
25
-
26
-
27
-
28
-
29
-
30
-
31
-
32
-
33
-
34
-
35
-
36
-
37
-
38
-
39
-
40
-
41
-
42
-
43
-
44
-
45
-
46
-
47
-
 48
48 -
 49
49 -
 50
50 -
 51
51 -
 52
52 -
 53
53 -
 54
54 -
 55
55 -
 56
56 -
 57
57 -
 58
58 -
 59
59 -
 60
60 -
 61
61 -
 62
62 -
 63
63 -
 64
64 -
 65
65 -
 66
66 -
 67
67 -
 68
68 -
69
-
70
-
71
-
72
-
73
-
74
-
75
-
76
-
77
-
78
-
79
-
80
-
81
-
82
-
83
-
84
-
85
-
86
-
87
-
88
-
89
-
90
-
91
-
92
-
93
-
94
-
95
-
96
-
97
-
98
-
99
-
100
-
101
-
102
-
103
-
104
-
105
-
106
-
107
-
108
-
109
-
110
-
111
-
112
-
113
-
114
-
115
-
116
-
117
-
118
-
119
-
120
-
121
-
122
-
123
-
124
-
125
-
126
-
127
-
128
-
129
-
130
-
131
-
132
-
133
-
134
-
135
-
136
-
137
-
138
 |
 |

Fiscal Year Ended January 31,
2016 2015 2014
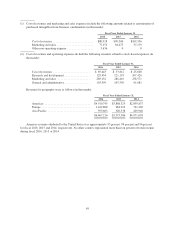
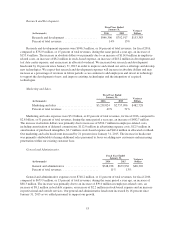
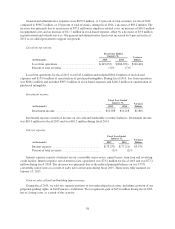
Revenues by geography:
Americas .................................... 74% 72% 71%
Europe ...................................... 17 18 18
Asia Pacific .................................. 9 10 11
100% 100% 100%
Revenue constant
currency growth rates
(as compared to the
comparable prior periods)
Fiscal Year Ended
January 31, 2016
compared to
Fiscal Year Ended
January 31, 2015
Fiscal Year Ended
January 31, 2015
compared to
Fiscal Year Ended
January 31, 2014
Fiscal Year Ended
January 31, 2014
compared to
Fiscal Year Ended
January 31, 2013
Americas ................... 27% 33% 37%
Europe ..................... 29% 34% 36%
Asia Pacific ................. 26% 26% 19%
Total growth ................ 27% 33% 34%
We present constant currency information to provide a framework for assessing how our underlying
business performed excluding the effect of foreign currency rate fluctuations. To present this information, current
and comparative prior period results for entities reporting in currencies other than United States dollars are
converted into United States dollars at the weighted average exchange rate for the year being compared to for
growth rate calculations presented, rather than the actual exchange rates in effect during that period.
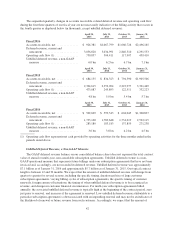
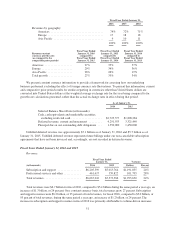
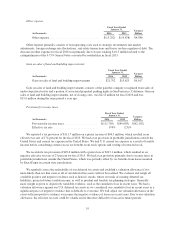
As of January 31,
2016 2015
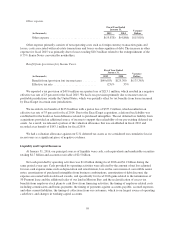
Selected Balance Sheet Data (in thousands):
Cash, cash equivalents and marketable securities,
excluding restricted cash ..................... $2,725,377 $1,890,284
Deferred revenue, current and noncurrent ......... 4,291,553 3,321,449
Principal due on our outstanding debt obligations . . . 1,350,000 1,450,000
Unbilled deferred revenue was approximately $7.1 billion as of January 31, 2016 and $5.7 billion as of
January 31, 2015. Unbilled deferred revenue represents future billings under our non-cancelable subscription
agreements that have not been invoiced and, accordingly, are not recorded in deferred revenue.
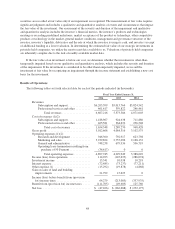
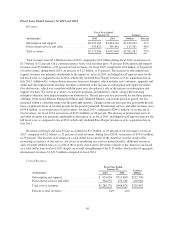
Fiscal Years Ended January 31, 2016 and 2015
Revenues.
Fiscal Year Ended
January 31, Variance
(in thousands) 2016 2015 Dollars Percent
Subscription and support ................ $6,205,599 $5,013,764 $1,191,835 24%
Professional services and other ............ 461,617 359,822 101,795 28%
Total revenues ......................... $6,667,216 $5,373,586 $1,293,630 24%
Total revenues were $6.7 billion for fiscal 2016, compared to $5.4 billion during the same period a year ago, an
increase of $1.3 billion, or 24 percent. On a constant currency basis, total revenues grew 27 percent. Subscription
and support revenues were $6.2 billion, or 93 percent of total revenues, for fiscal 2016, compared to $5.0 billion, or
93 percent of total revenues, during the same period a year ago, an increase of $1.2 billion, or 24 percent. The
increase in subscription and support revenues in fiscal 2016 was primarily attributable to volume-driven increases
51