Salesforce.com 2016 Annual Report Download - page 42
Download and view the complete annual report
Please find page 42 of the 2016 Salesforce.com annual report below. You can navigate through the pages in the report by either clicking on the pages listed below, or by using the keyword search tool below to find specific information within the annual report.-
 1
1 -
2
-
3
-
4
-
5
-
6
-
7
-
8
-
9
-
10
-
11
-
12
-
13
-
14
-
15
-
16
-
17
-
18
-
19
-
20
-
21
-
22
-
23
-
24
-
25
-
26
-
27
-
28
-
29
-
30
-
31
-
 32
32 -
 33
33 -
 34
34 -
 35
35 -
 36
36 -
 37
37 -
 38
38 -
 39
39 -
 40
40 -
 41
41 -
 42
42 -
 43
43 -
 44
44 -
 45
45 -
 46
46 -
 47
47 -
 48
48 -
 49
49 -
 50
50 -
 51
51 -
 52
52 -
53
-
54
-
55
-
56
-
57
-
58
-
59
-
60
-
61
-
62
-
63
-
64
-
65
-
66
-
67
-
68
-
69
-
70
-
71
-
72
-
73
-
74
-
75
-
76
-
77
-
78
-
79
-
80
-
81
-
82
-
83
-
84
-
85
-
86
-
87
-
88
-
89
-
90
-
91
-
92
-
93
-
94
-
95
-
96
-
97
-
98
-
99
-
100
-
101
-
102
-
103
-
104
-
105
-
106
-
107
-
108
-
109
-
110
-
111
-
112
-
113
-
114
-
115
-
116
-
117
-
118
-
119
-
120
-
121
-
122
-
123
-
124
-
125
-
126
-
127
-
128
-
129
-
130
-
131
-
132
-
133
-
134
-
135
-
136
-
137
-
138
 |
 |

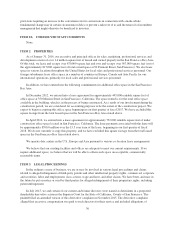
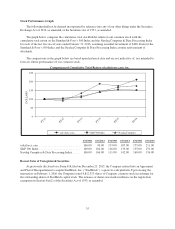
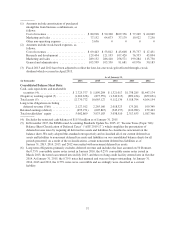
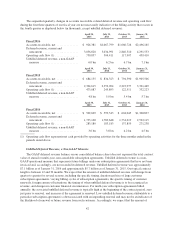
Stock Performance Graph
The following shall not be deemed incorporated by reference into any of our other filings under the Securities
Exchange Act of 1934, as amended, or the Securities Act of 1933, as amended.
The graph below compares the cumulative total stockholder return on our common stock with the
cumulative total return on the Standard & Poor’s 500 Index and the Nasdaq Computer & Data Processing Index
for each of the last five fiscal years ended January 31, 2016, assuming an initial investment of $100. Data for the
Standard & Poor’s 500 Index and the Nasdaq Computer & Data Processing Index assume reinvestment of
dividends.
The comparisons in the graph below are based upon historical data and are not indicative of, nor intended to
forecast, future performance of our common stock.
Comparison of Cumulative Total Return of salesforce.com, inc.
0
50
FY11
FY12
FY13
FY14
FY15
FY16
100
150
250
200
DOLLARS
salesforce.com Nasdaq ComputerS&P 500 Index
1/31/2011 1/31/2012 1/31/2013 1/31/2014 1/31/2015 1/31/2016
salesforce.com ............................ 100.00 90.00 133.00 187.00 175.00 211.00
S&P 500 Index ........................... 100.00 102.00 116.00 139.00 155.00 151.00
Nasdaq Computer & Data Processing Index ..... 100.00 106.00 111.00 142.00 168.00 176.00
Recent Sales of Unregistered Securities
As previously disclosed on a Form 8-K filed on December 23, 2015, the Company entered into an Agreement
and Plan of Reorganization to acquire SteelBrick, Inc. (“SteelBrick”), a quote-to-cash platform. Upon closing the
transaction on February 1, 2016, the Company issued 4,812,325 shares of Company common stock in exchange for
the outstanding shares of SteelBrick capital stock. The issuance of shares was made in reliance on the registration
exemption in Section 4(a)(2) of the Securities Act of 1933, as amended.
35