Salesforce.com 2016 Annual Report Download - page 78
Download and view the complete annual report
Please find page 78 of the 2016 Salesforce.com annual report below. You can navigate through the pages in the report by either clicking on the pages listed below, or by using the keyword search tool below to find specific information within the annual report.-
 1
1 -
2
-
3
-
4
-
5
-
6
-
7
-
8
-
9
-
10
-
11
-
12
-
13
-
14
-
15
-
16
-
17
-
18
-
19
-
20
-
21
-
22
-
23
-
24
-
25
-
26
-
27
-
28
-
29
-
30
-
31
-
32
-
33
-
34
-
35
-
36
-
37
-
38
-
39
-
40
-
41
-
42
-
43
-
44
-
45
-
46
-
47
-
48
-
49
-
50
-
51
-
52
-
53
-
54
-
55
-
56
-
57
-
58
-
59
-
60
-
61
-
62
-
63
-
64
-
65
-
66
-
67
-
 68
68 -
 69
69 -
 70
70 -
 71
71 -
 72
72 -
 73
73 -
 74
74 -
 75
75 -
 76
76 -
 77
77 -
 78
78 -
 79
79 -
 80
80 -
 81
81 -
 82
82 -
 83
83 -
 84
84 -
 85
85 -
 86
86 -
 87
87 -
 88
88 -
89
-
90
-
91
-
92
-
93
-
94
-
95
-
96
-
97
-
98
-
99
-
100
-
101
-
102
-
103
-
104
-
105
-
106
-
107
-
108
-
109
-
110
-
111
-
112
-
113
-
114
-
115
-
116
-
117
-
118
-
119
-
120
-
121
-
122
-
123
-
124
-
125
-
126
-
127
-
128
-
129
-
130
-
131
-
132
-
133
-
134
-
135
-
136
-
137
-
138
 |
 |
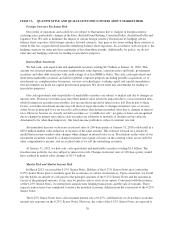
interest rate risk. Generally, the fair values of our fixed interest rate 0.25% Senior Notes will increase as interest
rates fall and decrease as interest rates rise. In addition, the fair value of our 0.25% Senior Notes is affected by
our stock price. The principal balance of our 0.25% Senior Notes was $1.15 billion as of January 31, 2016. The
total estimated fair value of our 0.25% Senior Notes at January 31, 2016 was $1.4 billion. The fair value was
determined based on the closing trading price per $100 of the 0.25% Senior Notes as of the last day of trading for
the fourth quarter of fiscal 2016, which was $119.24.
In October 2014, we entered into the Credit Agreement, which provides for the $650.0 million Credit
Facility that matures in October 2019. Borrowings under the Credit Facility bear interest, at our option, at either a
base rate formula, as defined in the Credit Agreement, or a LIBOR based formula, each as set forth in the Credit
Agreement. Additionally, we are obligated to pay an ongoing commitment fee at a rate between 0.125% and
0.25%. Interest and the commitment fees are payable in arrears quarterly. As of January 31, 2016 there was no
outstanding borrowing amount under the Credit Agreement.
By entering into the Credit Agreement, we have assumed risks associated with variable interest rates based
upon a variable base rate, as defined in the Credit Agreement, or LIBOR. Changes in the overall level of interest
rates affect the interest expense that we recognize in our statements of operations.
We deposit our cash with multiple financial institutions, therefore our deposits, at times, may exceed
federally insured limits.
The bank counterparties to the derivative contracts potentially expose us to credit-related losses in the event
of their nonperformance. To mitigate that risk, we only contract with counterparties who meet the minimum
requirements under our counterparty risk assessment process. We monitor ratings, credit spreads and potential
downgrades on at least a quarterly basis. Based on our on-going assessment of counterparty risk, we adjust our
exposure to various counterparties. We generally enter into master netting arrangements, which reduce credit risk
by permitting net settlement of transactions with the same counterparty. However, we do not have any master
netting arrangements in place with collateral features.
Our strategic investments portfolio consists of investments in over 150 privately held companies, primarily
comprised of independent software vendors and system integrators. We invest in early-to-late stage technology
and professional cloud service companies across the globe to support our key business initiatives, which include,
among other things, extending the capabilities of our platform and CRM offerings, increasing the ecosystem of
enterprise cloud companies and partners, accelerating the adoption of cloud technologies and creating the next-
generation of mobile applications and connected products. We invest in both domestic and international
companies and currently hold investments in all of our regions: the Americas, Europe and Asia Pacific. Our
investments in these companies range from $0.2 million to over $70.0 million, with 14 investments individually
equal to or in excess of $10 million. As of January 31, 2016 and January 31, 2015 the carrying value of our
investments in privately held companies was $504.5 million and $158.0 million, respectively. The estimated fair
value of our investments in privately held companies was $714.1 million and $280.0 million as of January 31,
2016 and January 31, 2015, respectively. The financial success of our investment in any company is typically
dependent on a liquidity event, such as a public offering, acquisition or other favorable market event reflecting
appreciation to the cost of our initial investment. If we determine that any of our investments in such companies
have experienced a decline in fair value, we may be required to record an impairment that is other than
temporary, which could be material. We have in the past written off the full value of specific investments.
Similar situations could occur in the future and negatively impact our financial results. All of our investments are
subject to a risk of partial or total loss of investment capital.
71