Salesforce.com 2016 Annual Report Download - page 96
Download and view the complete annual report
Please find page 96 of the 2016 Salesforce.com annual report below. You can navigate through the pages in the report by either clicking on the pages listed below, or by using the keyword search tool below to find specific information within the annual report.-
 1
1 -
2
-
3
-
4
-
5
-
6
-
7
-
8
-
9
-
10
-
11
-
12
-
13
-
14
-
15
-
16
-
17
-
18
-
19
-
20
-
21
-
22
-
23
-
24
-
25
-
26
-
27
-
28
-
29
-
30
-
31
-
32
-
33
-
34
-
35
-
36
-
37
-
38
-
39
-
40
-
41
-
42
-
43
-
44
-
45
-
46
-
47
-
48
-
49
-
50
-
51
-
52
-
53
-
54
-
55
-
56
-
57
-
58
-
59
-
60
-
61
-
62
-
63
-
64
-
65
-
66
-
67
-
68
-
69
-
70
-
71
-
72
-
73
-
74
-
75
-
76
-
77
-
78
-
79
-
80
-
81
-
82
-
83
-
84
-
85
-
 86
86 -
 87
87 -
 88
88 -
 89
89 -
 90
90 -
 91
91 -
 92
92 -
 93
93 -
 94
94 -
 95
95 -
 96
96 -
 97
97 -
 98
98 -
 99
99 -
 100
100 -
 101
101 -
 102
102 -
 103
103 -
 104
104 -
 105
105 -
 106
106 -
107
-
108
-
109
-
110
-
111
-
112
-
113
-
114
-
115
-
116
-
117
-
118
-
119
-
120
-
121
-
122
-
123
-
124
-
125
-
126
-
127
-
128
-
129
-
130
-
131
-
132
-
133
-
134
-
135
-
136
-
137
-
138
 |
 |

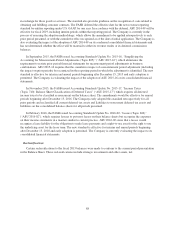
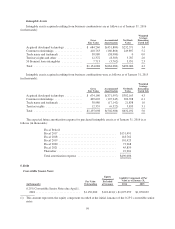
2. Investments
Marketable Securities
At January 31, 2016, marketable securities consisted of the following (in thousands):
Investments classified as Marketable Securities
Amortized
Cost
Unrealized
Gains
Unrealized
Losses Fair Value
Corporate notes and obligations ............ $ 949,266 $1,398 $(2,983) $ 947,681
U.S. treasury securities ................... 157,625 375 (56) 157,944
Mortgage backed obligations .............. 104,242 106 (323) 104,025
Asset backed securities ................... 271,292 186 (226) 271,252
Municipal securities ..................... 44,934 209 (6) 45,137
Foreign government obligations ............ 18,014 42 (5) 18,051
U.S. agency obligations ................... 16,076 16 (6) 16,086
Covered bonds .......................... 6,690 148 0 6,838
Total marketable securities ................ $1,568,139 $2,480 $(3,605) $1,567,014
At January 31, 2015, marketable securities consisted of the following (in thousands):
Investments classified as Marketable Securities
Amortized
Cost
Unrealized
Gains
Unrealized
Losses Fair Value
Corporate notes and obligations ............... $605,724 $3,031 $(481) $608,274
U.S. treasury securities ...................... 73,226 257 (1) 73,482
Mortgage backed obligations ................. 44,181 159 (415) 43,925
Asset backed securities ...................... 120,049 131 (43) 120,137
Municipal securities ........................ 36,447 115 (25) 36,537
Foreign government obligations ............... 12,023 278 0 12,301
U.S. agency obligations ...................... 19,488 26 (4) 19,510
Covered bonds ............................. 66,816 1,185 0 68,001
Total marketable securities ................... $977,954 $5,182 $(969) $982,167
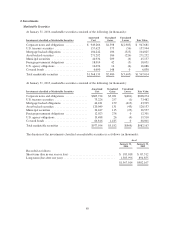
The duration of the investments classified as marketable securities is as follows (in thousands):
As of
January 31,
2016
January 31,
2015
Recorded as follows:
Short-term (due in one year or less) ............................... $ 183,018 $ 87,312
Long-term (due after one year) ................................... 1,383,996 894,855
$1,567,014 $982,167
89