Salesforce.com 2016 Annual Report Download - page 114
Download and view the complete annual report
Please find page 114 of the 2016 Salesforce.com annual report below. You can navigate through the pages in the report by either clicking on the pages listed below, or by using the keyword search tool below to find specific information within the annual report.-
 1
1 -
2
-
3
-
4
-
5
-
6
-
7
-
8
-
9
-
10
-
11
-
12
-
13
-
14
-
15
-
16
-
17
-
18
-
19
-
20
-
21
-
22
-
23
-
24
-
25
-
26
-
27
-
28
-
29
-
30
-
31
-
32
-
33
-
34
-
35
-
36
-
37
-
38
-
39
-
40
-
41
-
42
-
43
-
44
-
45
-
46
-
47
-
48
-
49
-
50
-
51
-
52
-
53
-
54
-
55
-
56
-
57
-
58
-
59
-
60
-
61
-
62
-
63
-
64
-
65
-
66
-
67
-
68
-
69
-
70
-
71
-
72
-
73
-
74
-
75
-
76
-
77
-
78
-
79
-
80
-
81
-
82
-
83
-
84
-
85
-
86
-
87
-
88
-
89
-
90
-
91
-
92
-
93
-
94
-
95
-
96
-
97
-
98
-
99
-
100
-
101
-
102
-
103
-
 104
104 -
 105
105 -
 106
106 -
 107
107 -
 108
108 -
 109
109 -
 110
110 -
 111
111 -
 112
112 -
 113
113 -
 114
114 -
 115
115 -
 116
116 -
 117
117 -
 118
118 -
 119
119 -
 120
120 -
 121
121 -
 122
122 -
 123
123 -
 124
124 -
125
-
126
-
127
-
128
-
129
-
130
-
131
-
132
-
133
-
134
-
135
-
136
-
137
-
138
 |
 |
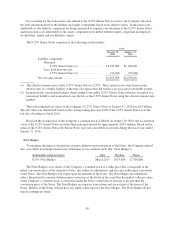
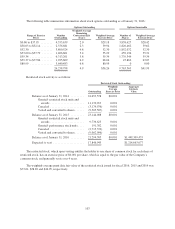
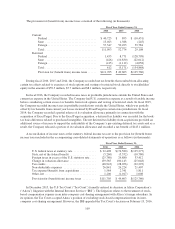
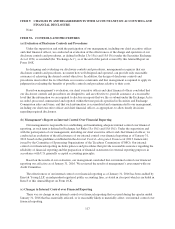
The following table summarizes information about stock options outstanding as of January 31, 2016 :
Options Outstanding Options Exercisable
Range of Exercise
Prices
Number
Outstanding
Weighted-Average
Remaining
Contractual Life
(Years)
Weighted-Average
Exercise Price
Number of
Shares
Weighted-Average
Exercise Price
$0.86 to $37.95 ........ 4,555,639 2.0 $29.18 3,838,627 $28.42
$38.03 to $52.14 ....... 2,556,681 2.3 39.94 1,826,462 39.62
$52.30 ............... 3,800,524 4.8 52.30 1,852,072 52.30
$53.60 to $57.79 ....... 1,466,601 5.4 55.29 459,196 55.31
$59.34 ............... 6,313,261 5.8 59.34 1,739,344 59.34
$59.37 to $77.86 ....... 1,925,609 6.2 68.04 47,862 63.07
$80.99 ............... 5,640,483 6.8 80.99 0 0.00
26,258,798 4.9 $56.26 9,763,563 $41.99
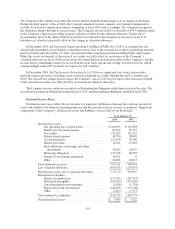
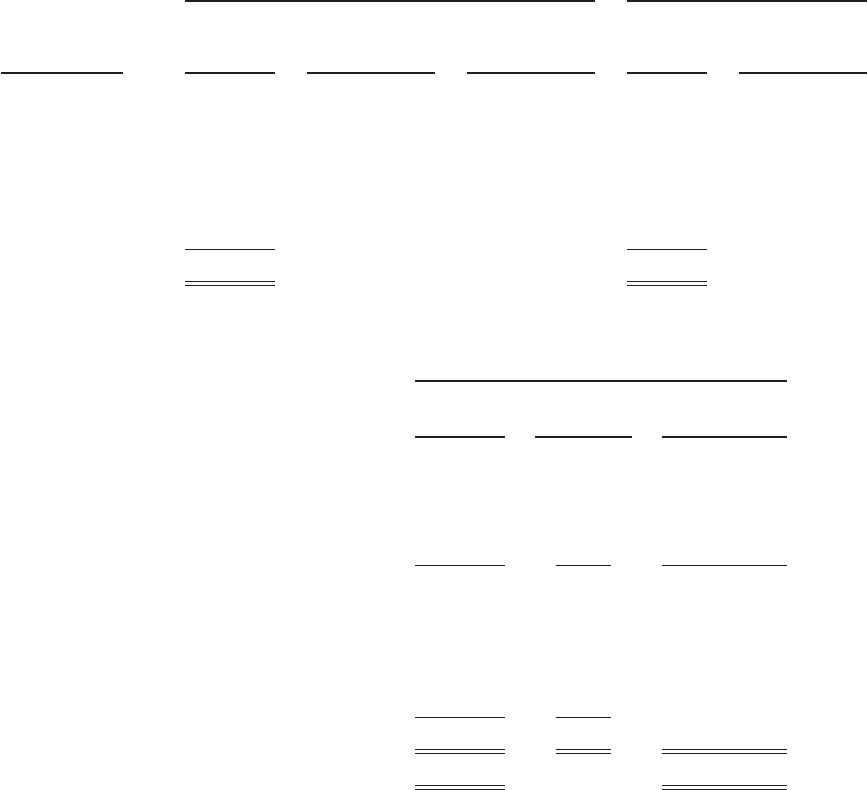
Restricted stock activity is as follows:
Restricted Stock Outstanding
Outstanding
Weighted-
Average
Exercise Price
Aggregate
Intrinsic
Value
Balance as of January 31, 2014 ......... 24,653,578 $0.001
Granted- restricted stock units and
awards ....................... 11,170,913 0.001
Canceled ....................... (3,174,976) 0.001
Vested and converted to shares ...... (9,505,507) 0.001
Balance as of January 31, 2015 ......... 23,144,008 $0.001
Granted- restricted stock units and
awards ....................... 9,736,623 0.001
Granted- performance stock units .... 191,382 0.001
Canceled ....................... (2,715,332) 0.001
Vested and converted to shares ...... (9,062,096) 0.001
Balance as of January 31, 2016 ......... 21,294,585 $0.001 $1,449,309,455
Expected to vest ..................... 17,846,945 $1,214,663,077
The restricted stock, which upon vesting entitles the holder to one share of common stock for each share of
restricted stock, has an exercise price of $0.001 per share, which is equal to the par value of the Company’s
common stock, and generally vests over 4 years.
The weighted-average grant date fair value of the restricted stock issued for fiscal 2016, 2015 and 2014 was
$73.61, $58.89 and $46.99, respectively.
107