Salesforce.com 2016 Annual Report Download - page 85
Download and view the complete annual report
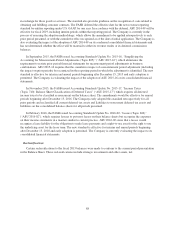
Please find page 85 of the 2016 Salesforce.com annual report below. You can navigate through the pages in the report by either clicking on the pages listed below, or by using the keyword search tool below to find specific information within the annual report.-
 1
1 -
2
-
3
-
4
-
5
-
6
-
7
-
8
-
9
-
10
-
11
-
12
-
13
-
14
-
15
-
16
-
17
-
18
-
19
-
20
-
21
-
22
-
23
-
24
-
25
-
26
-
27
-
28
-
29
-
30
-
31
-
32
-
33
-
34
-
35
-
36
-
37
-
38
-
39
-
40
-
41
-
42
-
43
-
44
-
45
-
46
-
47
-
48
-
49
-
50
-
51
-
52
-
53
-
54
-
55
-
56
-
57
-
58
-
59
-
60
-
61
-
62
-
63
-
64
-
65
-
66
-
67
-
68
-
69
-
70
-
71
-
72
-
73
-
74
-
 75
75 -
 76
76 -
 77
77 -
 78
78 -
 79
79 -
 80
80 -
 81
81 -
 82
82 -
 83
83 -
 84
84 -
 85
85 -
 86
86 -
 87
87 -
 88
88 -
 89
89 -
 90
90 -
 91
91 -
 92
92 -
 93
93 -
 94
94 -
 95
95 -
96
-
97
-
98
-
99
-
100
-
101
-
102
-
103
-
104
-
105
-
106
-
107
-
108
-
109
-
110
-
111
-
112
-
113
-
114
-
115
-
116
-
117
-
118
-
119
-
120
-
121
-
122
-
123
-
124
-
125
-
126
-
127
-
128
-
129
-
130
-
131
-
132
-
133
-
134
-
135
-
136
-
137
-
138
 |
 |

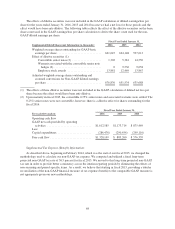
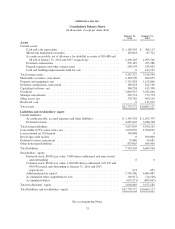
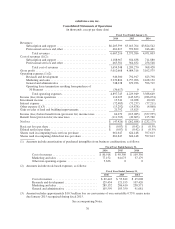
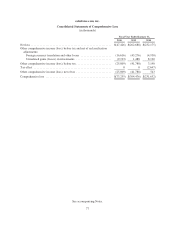
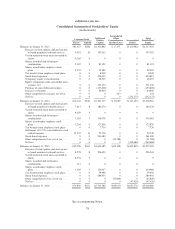
salesforce.com, inc.
Consolidated Statements of Stockholders’ Equity
(in thousands)
Common Stock Additional
Paid-in
Capital
Accumulated
Other
Comprehensive
Income/(Loss)
Accumulated
Deficit
Total
Stockholders’
EquityShares Amount
Balances at January 31, 2013 ............... 585,627 $586 $2,410,892 $ 17,137 $(110,982) $2,317,633
Exercise of stock options and stock grants
to board members for board services . . . 9,952 10 197,012 0 0 197,022
Vested restricted stock units converted to
shares ........................... 9,265 9 0 0 0 9
Shares issued related to business
combinations ...................... 2,367 2 81,191 0 0 81,193
Shares issued under employee stock
plans ............................ 2,932 3 92,482 0 0 92,485
Tax benefits from employee stock plans . . 0 0 8,048 0 0 8,048
Stock-based expenses ................. 0 0 494,615 0 0 494,615
Temporary equity reclassification ....... 0 0 26,907 0 0 26,907
Equity component of the convertible notes
issuance, net ...................... 0 0 121,230 0 0 121,230
Purchase of convertible note hedges ..... 0 0 (153,800) 0 0 (153,800)
Issuance of warrants .................. 0 0 84,800 0 0 84,800
Other comprehensive income, net of tax . . 0 0 0 543 0 543
Net loss ............................ 0 0 0 0 (232,175) (232,175)
Balances at January 31, 2014 ............... 610,143 $610 $3,363,377 $ 17,680 $(343,157) $3,038,510
Exercise of stock options and stock grants
to board members for board services . . . 7,413 8 182,270 0 0 182,278
Vested restricted stock units converted to
shares ........................... 9,259 9 0 0 0 9
Shares issued related to business
combinations ...................... 7,185 7 339,076 0 0 339,083
Shares issued under employee stock
plans ............................ 3,264 4 127,816 0 0 127,820
Tax benefits from employee stock plans . . 0 0 7,730 0 0 7,730
Settlement of 0.75% convertible notes and
related warrants .................... 13,332 13 22,736 0 0 22,749
Stock-based expenses ................. 0 0 561,480 0 0 561,480
Other comprehensive loss, net of tax ..... 0 0 0 (41,788) 0 (41,788)
Net loss ............................ 0 0 0 0 (262,688) (262,688)
Balances at January 31, 2015 ............... 650,596 $651 $4,604,485 $(24,108) $(605,845) $3,975,183
Exercise of stock options and stock grants
to board members for board services . . . 8,278 8 296,493 0 0 296,501
Vested restricted stock units converted to
shares ........................... 8,933 9 0 0 0 9
Shares issued related to business
combinations ...................... 117 0 0 0 0 0
Shares issued under employee stock
plans ............................ 3,005 3 154,957 0 0 154,960
Tax benefits from employee stock plans . . 0 0 59,496 0 0 59,496
Stock-based expenses ................. 0 0 589,955 0 0 589,955
Other comprehensive loss, net of tax ..... 0 0 0 (25,809) 0 (25,809)
Net loss ............................ 0 0 0 0 (47,426) (47,426)
Balances at January 31, 2016 ............... 670,929 $671 $5,705,386 $(49,917) $(653,271) $5,002,869
See accompanying Notes.
78