Salesforce.com 2015 Annual Report Download - page 83
Download and view the complete annual report
Please find page 83 of the 2015 Salesforce.com annual report below. You can navigate through the pages in the report by either clicking on the pages listed below, or by using the keyword search tool below to find specific information within the annual report.-
 1
1 -
2
-
3
-
4
-
5
-
6
-
7
-
8
-
9
-
10
-
11
-
12
-
13
-
14
-
15
-
16
-
17
-
18
-
19
-
20
-
21
-
22
-
23
-
24
-
25
-
26
-
27
-
28
-
29
-
30
-
31
-
32
-
33
-
34
-
35
-
36
-
37
-
38
-
39
-
40
-
41
-
42
-
43
-
44
-
45
-
46
-
47
-
48
-
49
-
50
-
51
-
52
-
53
-
54
-
55
-
56
-
57
-
58
-
59
-
60
-
61
-
62
-
63
-
64
-
65
-
66
-
67
-
68
-
69
-
70
-
71
-
72
-
 73
73 -
 74
74 -
 75
75 -
 76
76 -
 77
77 -
 78
78 -
 79
79 -
 80
80 -
 81
81 -
 82
82 -
 83
83 -
 84
84 -
 85
85 -
 86
86 -
 87
87 -
 88
88 -
 89
89 -
 90
90 -
 91
91 -
 92
92 -
 93
93 -
94
-
95
-
96
-
97
-
98
-
99
-
100
-
101
-
102
-
103
-
104
-
105
-
106
-
107
-
108
-
109
-
110
-
111
-
112
-
113
-
114
-
115
-
116
-
117
-
118
-
119
-
120
-
121
-
122
-
123
-
124
-
125
-
126
-
127
-
128
-
129
-
130
-
131
-
132
-
133
-
134
 |
 |

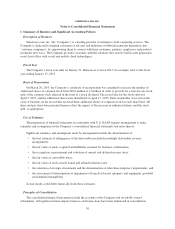
Segments
The Company operates as one operating segment. Operating segments are defined as components of an
enterprise for which separate financial information is evaluated regularly by the chief operating decision maker,
who is the chief executive officer, in deciding how to allocate resources and assessing performance. Over the past
few years, the Company has completed several acquisitions. These acquisitions have allowed the Company to
expand its offerings, presence and reach in various market segments of the enterprise cloud computing market.
While the Company has offerings in multiple enterprise cloud computing market segments, the Company’s
business operates in one operating segment because all of the Company’s offerings operate on a single platform
and are deployed in an identical way, and the Company’s chief operating decision maker evaluates the
Company’s financial information and resources and assesses the performance of these resources on a
consolidated basis. Since the Company operates in one operating segment, all required financial segment
information can be found in the consolidated financial statements.
Concentrations of Credit Risk and Significant Customers
The Company’s financial instruments that are exposed to concentrations of credit risk consist primarily of
cash and cash equivalents, marketable securities, restricted cash and trade accounts receivable. Although the
Company deposits its cash with multiple financial institutions, its deposits, at times, may exceed federally
insured limits. Collateral is not required for accounts receivable. The Company maintains an allowance for
doubtful accounts receivable balances. This allowance is based upon historical loss patterns, the number of days
that billings are past due and an evaluation of the potential risk of loss associated with delinquent accounts.
No single customer accounted for more than five percent of accounts receivable at January 31, 2015 and
January 31, 2014. No single customer accounted for five percent or more of total revenue during fiscal 2015,
2014 and 2013.
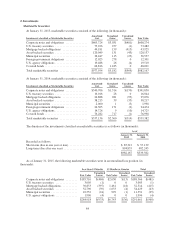
Geographic Locations
As of January 31, 2015 and 2014, assets located outside the Americas were 12 percent and 12 percent of
total assets, respectively.
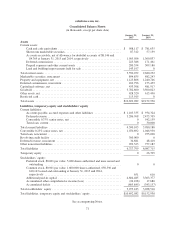
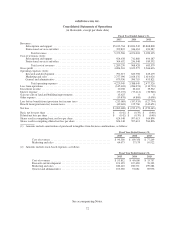
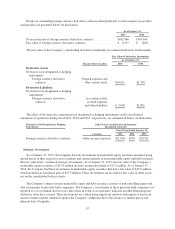
Revenues by geographical region are as follows (in thousands):
Fiscal Year Ended January 31,
2015 2014 2013
Americas ............................... $3,868,329 $2,899,837 $2,123,736
Europe ................................. 984,919 741,220 525,304
Asia Pacific ............................. 520,338 429,946 401,155
$5,373,586 $4,071,003 $3,050,195
Americas revenue attributed to the United States was approximately 94 percent, 96 percent and 94 percent
in fiscal 2015, 2014 and 2013, respectively. No other country represented more than ten percent of total revenue
during fiscal 2015, 2014 or 2013.
Revenue Recognition
The Company derives its revenues from two sources: (1) subscription revenues, which are comprised of
subscription fees from customers accessing the Company’s enterprise cloud computing services and from
customers paying for additional support beyond the standard support that is included in the basic subscription
fees; and (2) related professional services such as process mapping, project management, implementation
services and other revenue. “Other revenue” consists primarily of training fees.
77