Salesforce.com 2015 Annual Report Download - page 60
Download and view the complete annual report
Please find page 60 of the 2015 Salesforce.com annual report below. You can navigate through the pages in the report by either clicking on the pages listed below, or by using the keyword search tool below to find specific information within the annual report.-
 1
1 -
2
-
3
-
4
-
5
-
6
-
7
-
8
-
9
-
10
-
11
-
12
-
13
-
14
-
15
-
16
-
17
-
18
-
19
-
20
-
21
-
22
-
23
-
24
-
25
-
26
-
27
-
28
-
29
-
30
-
31
-
32
-
33
-
34
-
35
-
36
-
37
-
38
-
39
-
40
-
41
-
42
-
43
-
44
-
45
-
46
-
47
-
48
-
49
-
 50
50 -
 51
51 -
 52
52 -
 53
53 -
 54
54 -
 55
55 -
 56
56 -
 57
57 -
 58
58 -
 59
59 -
 60
60 -
 61
61 -
 62
62 -
 63
63 -
 64
64 -
 65
65 -
 66
66 -
 67
67 -
 68
68 -
 69
69 -
 70
70 -
71
-
72
-
73
-
74
-
75
-
76
-
77
-
78
-
79
-
80
-
81
-
82
-
83
-
84
-
85
-
86
-
87
-
88
-
89
-
90
-
91
-
92
-
93
-
94
-
95
-
96
-
97
-
98
-
99
-
100
-
101
-
102
-
103
-
104
-
105
-
106
-
107
-
108
-
109
-
110
-
111
-
112
-
113
-
114
-
115
-
116
-
117
-
118
-
119
-
120
-
121
-
122
-
123
-
124
-
125
-
126
-
127
-
128
-
129
-
130
-
131
-
132
-
133
-
134
 |
 |

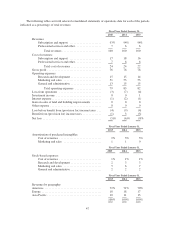
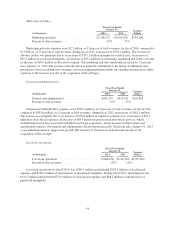
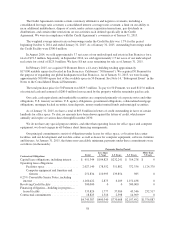
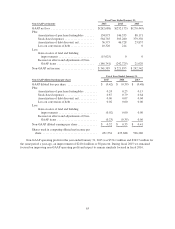
Marketing and Sales.
Fiscal Year Ended
January 31, Variance
Dollars(in thousands) 2014 2013
Marketing and sales ........................ $2,168,132 $1,614,026 $554,106
Percent of total revenues .................... 53% 53%
Marketing and sales expenses were $2.2 billion, or 53 percent of total revenues, for fiscal 2014, compared to
$1.6 billion, or 53 percent of total revenues, during fiscal 2013, an increase of $554.1 million. The increase in
absolute dollars was primarily due to an increase of $357.1 million in employee-related costs, an increase of
$59.3 million in stock-based expenses, an increase of $57.2 million in advertising, marketing and event costs and
an increase of $49.8 million in allocated overhead. Our marketing and sales headcount increased by 33 percent
since January 31, 2013. The increase in headcount was primarily attributable to the hiring of additional sales
personnel to focus on adding new customers and increasing penetration within our existing customer base, while
a portion of the increase was due to the acquisition of ExactTarget.
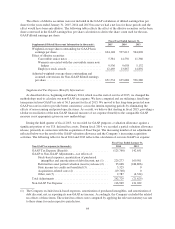
General and Administrative.
Fiscal Year Ended
January 31, Variance
Dollars(in thousands) 2014 2013
General and administrative ...................... $596,719 $433,821 $162,898
Percent of total revenues ........................ 15% 15%
General and administrative expenses were $596.7 million, or 15 percent of total revenues, for fiscal 2014,
compared to $433.8 million, or 15 percent of total revenues, during fiscal 2013, an increase of $162.9 million.
The increase was primarily due to an increase of $70.6 million in employee-related costs, an increase of $21.7
million in stock-based expenses, an increase of $48.3 million in professional and outside services, which
included transaction fees associated with the ExactTarget acquisition, and an increase in depreciation and
amortization expense. Our general and administrative headcount increased by 28 percent since January 31, 2013
as we added personnel to support our growth. The majority of the increase in headcount was due to the
acquisition of ExactTarget.
Loss from operations.
Fiscal Year Ended
January 31, Variance
Dollars(in thousands) 2014 2013
Loss from operations .......................... $(286,074) $(110,710) $(175,364)
Percent of total revenues ........................ (7)% (4)%
Loss from operations for fiscal 2014, was $286.1 million and included $503.3 million of stock-based
expenses and $146.5 million of amortization of purchased intangibles. During fiscal 2013, operating loss was
$110.7 million and included $379.4 million of stock-based expenses and $88.2 million of amortization of
purchased intangibles.
54