Salesforce.com 2015 Annual Report Download - page 70
Download and view the complete annual report
Please find page 70 of the 2015 Salesforce.com annual report below. You can navigate through the pages in the report by either clicking on the pages listed below, or by using the keyword search tool below to find specific information within the annual report.-
 1
1 -
2
-
3
-
4
-
5
-
6
-
7
-
8
-
9
-
10
-
11
-
12
-
13
-
14
-
15
-
16
-
17
-
18
-
19
-
20
-
21
-
22
-
23
-
24
-
25
-
26
-
27
-
28
-
29
-
30
-
31
-
32
-
33
-
34
-
35
-
36
-
37
-
38
-
39
-
40
-
41
-
42
-
43
-
44
-
45
-
46
-
47
-
48
-
49
-
50
-
51
-
52
-
53
-
54
-
55
-
56
-
57
-
58
-
59
-
 60
60 -
 61
61 -
 62
62 -
 63
63 -
 64
64 -
 65
65 -
 66
66 -
 67
67 -
 68
68 -
 69
69 -
 70
70 -
 71
71 -
 72
72 -
 73
73 -
 74
74 -
 75
75 -
 76
76 -
 77
77 -
 78
78 -
 79
79 -
 80
80 -
81
-
82
-
83
-
84
-
85
-
86
-
87
-
88
-
89
-
90
-
91
-
92
-
93
-
94
-
95
-
96
-
97
-
98
-
99
-
100
-
101
-
102
-
103
-
104
-
105
-
106
-
107
-
108
-
109
-
110
-
111
-
112
-
113
-
114
-
115
-
116
-
117
-
118
-
119
-
120
-
121
-
122
-
123
-
124
-
125
-
126
-
127
-
128
-
129
-
130
-
131
-
132
-
133
-
134
 |
 |

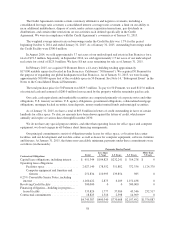
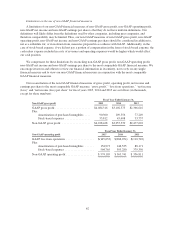
The effects of dilutive securities were not included in the GAAP calculation of diluted earnings/loss per
share for the years ended January 31, 2015, 2014 and 2013 because we had a net loss for those periods and the
effect would have been anti-dilutive. The following table reflects the effect of the dilutive securities on the basic
share count used in the GAAP earnings/loss per share calculation to derive the share count used for the non-
GAAP diluted earnings per share:
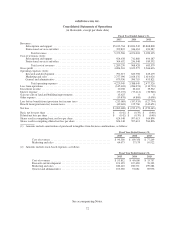
Fiscal Year Ended January 31,
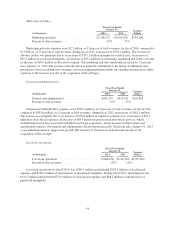
Supplemental Diluted Sharecount Information (in thousands): 2015 2014 2013
Weighted-average shares outstanding for GAAP basic
earnings per share .............................. 624,148 597,613 564,896
Effect of dilutive securities:
Convertible senior notes ....................... 5,381 14,550 11,360
Warrants associated with the convertible senior note
hedges ................................... 9,536 9,658 5,132
Employee stock awards ....................... 12,469 13,867 14,892
Adjusted weighted-average shares outstanding and
assumed conversions for Non-GAAP diluted earnings
per share ..................................... 651,534 635,688 596,280
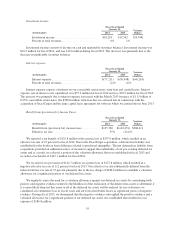
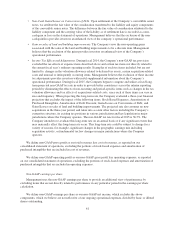
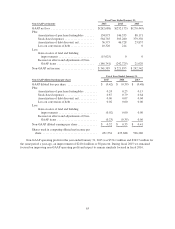
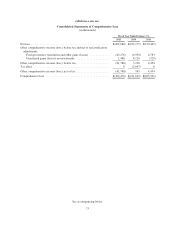
Supplemental Tax Expense (Benefit) Information:
As described above, beginning in February 2014, which was the start of our fiscal 2015, we changed the
methodology used to calculate our non-GAAP tax expense. We have computed and are utilizing a fixed long-
term projected non-GAAP tax rate of 36.5 percent for fiscal 2015. We moved to this long-term projected non-
GAAP tax rate in order to provide better consistency across the interim reporting periods by eliminating the
effects of non-recurring and period-specific items. As a result, we believe that starting in fiscal 2015, providing a
tabular reconciliation of the non-GAAP financial measure of tax expense (benefit) to the comparable GAAP
measure is not appropriate given our new methodology.
During the third quarter of fiscal 2013, we recorded for GAAP purposes a valuation allowance against a
significant portion of our U.S. deferred tax assets. During fiscal 2014, we recorded a partial valuation allowance
release, primarily in connection with the acquisition of ExactTarget. The increasing number of tax adjustments
reflected below was the result of the GAAP valuation allowance and the Company’s increasing acquisition
activities. The following table for fiscal 2014 and 2013 reflects the calculation of our non-GAAP tax expense:
Fiscal Year Ended January 31,
Non-GAAP tax expense (in thousands): 2014 2013
GAAP Tax Expense (Benefit) ........................... (125,760) 142,651
GAAP to Non-GAAP Adjustments—tax effects of:
Stock-based expenses, amortization of purchased
intangibles and amortization of debt discount, net (1) . . 229,277 169,501
Deferred tax asset partial valuation (reserve) release (2) . . 25,048 (186,806)
State income tax credits not benefited (3) .............. 5,325 0
Acquisitions-related costs (4) ....................... (19,708) 0
Other, net (5) .................................... 2,787 (4,324)
Total Adjustments .................................... 242,729 (21,629)
Non-GAAP Tax Expense .............................. 116,969 121,022
(1) The Company excluded stock-based expenses, amortization of purchased intangibles, and amortization of
debt discount, net, in reporting its non-GAAP net income. Accordingly, the Company excluded the related
tax effects of these items. The related tax effects were computed by applying the relevant statutory tax rate
to these items for each respective jurisdiction.
64