Salesforce.com 2015 Annual Report Download - page 40
Download and view the complete annual report
Please find page 40 of the 2015 Salesforce.com annual report below. You can navigate through the pages in the report by either clicking on the pages listed below, or by using the keyword search tool below to find specific information within the annual report.-
 1
1 -
2
-
3
-
4
-
5
-
6
-
7
-
8
-
9
-
10
-
11
-
12
-
13
-
14
-
15
-
16
-
17
-
18
-
19
-
20
-
21
-
22
-
23
-
24
-
25
-
26
-
27
-
28
-
29
-
 30
30 -
 31
31 -
 32
32 -
 33
33 -
 34
34 -
 35
35 -
 36
36 -
 37
37 -
 38
38 -
 39
39 -
 40
40 -
 41
41 -
 42
42 -
 43
43 -
 44
44 -
 45
45 -
 46
46 -
 47
47 -
 48
48 -
 49
49 -
 50
50 -
51
-
52
-
53
-
54
-
55
-
56
-
57
-
58
-
59
-
60
-
61
-
62
-
63
-
64
-
65
-
66
-
67
-
68
-
69
-
70
-
71
-
72
-
73
-
74
-
75
-
76
-
77
-
78
-
79
-
80
-
81
-
82
-
83
-
84
-
85
-
86
-
87
-
88
-
89
-
90
-
91
-
92
-
93
-
94
-
95
-
96
-
97
-
98
-
99
-
100
-
101
-
102
-
103
-
104
-
105
-
106
-
107
-
108
-
109
-
110
-
111
-
112
-
113
-
114
-
115
-
116
-
117
-
118
-
119
-
120
-
121
-
122
-
123
-
124
-
125
-
126
-
127
-
128
-
129
-
130
-
131
-
132
-
133
-
134
 |
 |

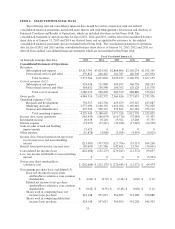
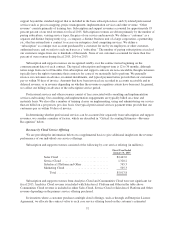
(1) Amounts include amortization of purchased
intangibles from business combinations, as
follows:
Cost of revenues ........................... $ 90,300 $109,356 $ 77,249 $ 60,069 $15,459
Marketing and sales ........................ 64,673 37,179 10,922 7,250 4,209
(2) Amounts include stock-based expenses, as
follows:
Cost of revenues ........................... $ 53,812 $ 45,608 $ 33,757 $ 17,451 $12,158
Research and development ................... 121,193 107,420 76,333 45,894 18,897
Marketing and sales ........................ 286,410 258,571 199,284 115,730 56,451
General and administrative .................. 103,350 91,681 69,976 50,183 32,923
(3) Fiscal 2013, 2012 and 2011 have been adjusted to reflect the four-for-one stock split effected through a
stock dividend which occurred in April 2013.
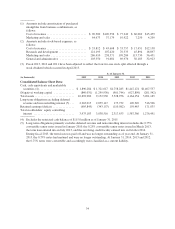
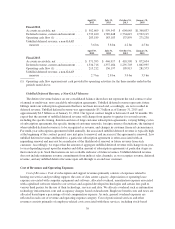
As of January 31,
(in thousands) 2015 2014 2013 2012 2011
Consolidated Balance Sheet Data:
Cash, cash equivalents and marketable
securities (4) ........................ $ 1,890,284 $ 1,321,017 $1,758,285 $1,447,174 $1,407,557
(Negative) working capital .............. (840,031) (1,299,936) (901,744) (627,809) (201,542)
Total assets ........................... 10,692,982 9,152,930 5,528,956 4,164,154 3,091,165
Long-term obligations excluding deferred
revenue and noncontrolling interest (5) . . . 2,263,015 2,059,117 175,732 109,349 516,506
Retained earnings (deficit) ............... (605,845) (343,157) (110,982) 159,463 171,035
Total stockholders’ equity controlling
interest ............................ 3,975,183 3,038,510 2,317,633 1,587,360 1,276,491
(4) Excludes the restricted cash balance of $115.0 million as of January 31, 2015.
(5) Long-term obligations primarily excludes deferred revenue and noncontrolling interest includes the 0.75%
convertible senior notes issued in January 2010, the 0.25% convertible senior notes issued in March 2013,
the term loan entered into in July 2013, and the revolving credit facility entered into in October 2014.
During fiscal 2015, the term loan was paid off and was no longer outstanding as of year end. At January 31,
2015, the 0.75% notes had matured and were no longer outstanding. At January 31, 2014, 2013 and 2012,
the 0.75% notes were convertible and accordingly were classified as a current liability.
34