Salesforce.com 2015 Annual Report Download - page 59
Download and view the complete annual report
Please find page 59 of the 2015 Salesforce.com annual report below. You can navigate through the pages in the report by either clicking on the pages listed below, or by using the keyword search tool below to find specific information within the annual report.-
 1
1 -
2
-
3
-
4
-
5
-
6
-
7
-
8
-
9
-
10
-
11
-
12
-
13
-
14
-
15
-
16
-
17
-
18
-
19
-
20
-
21
-
22
-
23
-
24
-
25
-
26
-
27
-
28
-
29
-
30
-
31
-
32
-
33
-
34
-
35
-
36
-
37
-
38
-
39
-
40
-
41
-
42
-
43
-
44
-
45
-
46
-
47
-
48
-
 49
49 -
 50
50 -
 51
51 -
 52
52 -
 53
53 -
 54
54 -
 55
55 -
 56
56 -
 57
57 -
 58
58 -
 59
59 -
 60
60 -
 61
61 -
 62
62 -
 63
63 -
 64
64 -
 65
65 -
 66
66 -
 67
67 -
 68
68 -
 69
69 -
70
-
71
-
72
-
73
-
74
-
75
-
76
-
77
-
78
-
79
-
80
-
81
-
82
-
83
-
84
-
85
-
86
-
87
-
88
-
89
-
90
-
91
-
92
-
93
-
94
-
95
-
96
-
97
-
98
-
99
-
100
-
101
-
102
-
103
-
104
-
105
-
106
-
107
-
108
-
109
-
110
-
111
-
112
-
113
-
114
-
115
-
116
-
117
-
118
-
119
-
120
-
121
-
122
-
123
-
124
-
125
-
126
-
127
-
128
-
129
-
130
-
131
-
132
-
133
-
134
 |
 |

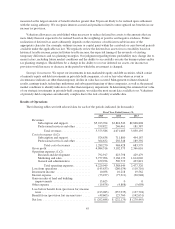
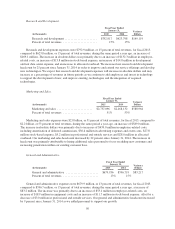
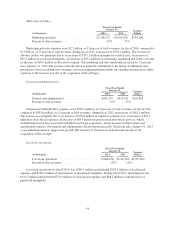
Revenues in Europe and Asia Pacific accounted for $1,171.2 million, or 29 percent of total revenues, for
fiscal 2014, compared to $926.5 million, or 30 percent of total revenues, during fiscal 2013, an increase of
$244.7 million, or 26 percent. The increase in revenues outside of the Americas on a total dollar basis was the
result of the increasing acceptance of our service, our focus on marketing our service internationally and reduced
attrition rates. Revenues outside of the Americas increased on a total dollar basis in fiscal 2014 despite an overall
strengthening of the U.S. dollar, which reduced aggregate international revenues by $24.4 million compared to
fiscal 2013.
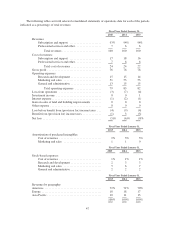
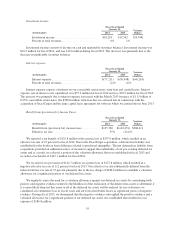
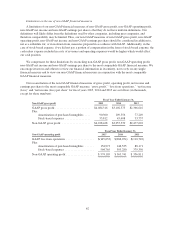
Cost of Revenues.
Fiscal Year Ended
January 31, Variance
Dollars(in thousands) 2014 2013
Subscription and support ....................... $711,880 $494,187 $217,693
Professional services and other .................. 256,548 189,392 67,156
Total cost of revenues ......................... $968,428 $683,579 $284,849
Percent of total revenues ....................... 24% 22%
Cost of revenues was $968.4 million, or 24 percent of total revenues, for fiscal 2014, compared to
$683.6 million, or 22 percent of total revenues, during fiscal 2013, an increase of $284.8 million. The increase in
absolute dollars was primarily due to an increase of $102.8 million in employee-related costs, an increase of
$48.9 million in service delivery costs, primarily due to our efforts in increasing data center capacity, an increase
of $80.4 million in depreciation and amortization expenses, $32.1 million of which related to the amortization of
acquired developed technology, an increase of $16.1 million in subcontractor and professional services expense,
an increase of $23.1 million in allocated overhead and an increase of $11.9 million in stock-based expenses. We
increased our customer support and professional services headcount by 58 percent since January 31, 2013 to meet
the higher demand for services from our customers, of which the majority was due to the acquisition of
ExactTarget. In June 2013, we entered into a large capital lease agreement for software for a period of nine years,
which consists of the contractual term of six years and a renewal option of three years. A portion of the
depreciation expense on this asset was allocated to cost of revenues which is included in the amount above.
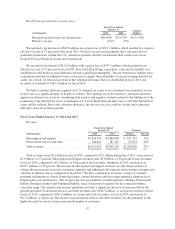
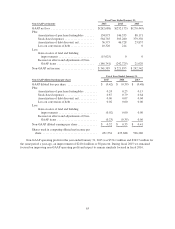
Research and Development.
Fiscal Year Ended
January 31, Variance
Dollars(in thousands) 2014 2013
Research and development ...................... $623,798 $429,479 $194,319
Percent of total revenues ....................... 15% 14%
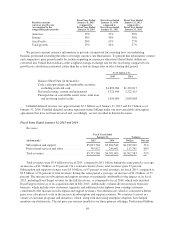
Research and development expenses were $623.8 million, or 15 percent of total revenues, for fiscal 2014,
compared to $429.5 million, or 14 percent of total revenues, during fiscal 2013, an increase of $194.3 million.
The increase in absolute dollars was due to an increase of $114.9 million in employee-related costs, an increase
of $31.1 million in stock-based expenses, an increase of $16.0 million in depreciation and amortization expenses,
an increase of $17.2 million in allocated overhead and an increase of $14.8 million in test data lab costs. We
increased our research and development headcount by 31 percent since January 31, 2013 in order to improve and
extend our service offerings and develop new technologies. The majority of the increase in headcount was due to
the acquisition of ExactTarget. In June 2013, we entered into a large capital lease agreement for software for a
period of nine years, which consists of the contractual term of six years and a renewal option of three years. A
portion of the depreciation expense on this asset was allocated to research and development which is included in
the amount above.
53