Salesforce.com 2015 Annual Report Download - page 68
Download and view the complete annual report
Please find page 68 of the 2015 Salesforce.com annual report below. You can navigate through the pages in the report by either clicking on the pages listed below, or by using the keyword search tool below to find specific information within the annual report.-
 1
1 -
2
-
3
-
4
-
5
-
6
-
7
-
8
-
9
-
10
-
11
-
12
-
13
-
14
-
15
-
16
-
17
-
18
-
19
-
20
-
21
-
22
-
23
-
24
-
25
-
26
-
27
-
28
-
29
-
30
-
31
-
32
-
33
-
34
-
35
-
36
-
37
-
38
-
39
-
40
-
41
-
42
-
43
-
44
-
45
-
46
-
47
-
48
-
49
-
50
-
51
-
52
-
53
-
54
-
55
-
56
-
57
-
 58
58 -
 59
59 -
 60
60 -
 61
61 -
 62
62 -
 63
63 -
 64
64 -
 65
65 -
 66
66 -
 67
67 -
 68
68 -
 69
69 -
 70
70 -
 71
71 -
 72
72 -
 73
73 -
 74
74 -
 75
75 -
 76
76 -
 77
77 -
 78
78 -
79
-
80
-
81
-
82
-
83
-
84
-
85
-
86
-
87
-
88
-
89
-
90
-
91
-
92
-
93
-
94
-
95
-
96
-
97
-
98
-
99
-
100
-
101
-
102
-
103
-
104
-
105
-
106
-
107
-
108
-
109
-
110
-
111
-
112
-
113
-
114
-
115
-
116
-
117
-
118
-
119
-
120
-
121
-
122
-
123
-
124
-
125
-
126
-
127
-
128
-
129
-
130
-
131
-
132
-
133
-
134
 |
 |

Limitations on the use of non-GAAP financial measures
A limitation of our non-GAAP financial measures of non-GAAP gross profit, non-GAAP operating profit,
non-GAAP net income and non-GAAP earnings per share is that they do not have uniform definitions. Our
definitions will likely differ from the definitions used by other companies, including peer companies, and
therefore comparability may be limited. Thus, our non-GAAP measures of non-GAAP gross profit, non-GAAP
operating profit, non-GAAP net income and non-GAAP earnings per share should be considered in addition to,
not as a substitute for, or in isolation from, measures prepared in accordance with GAAP. Additionally, in the
case of stock-based expense, if we did not pay a portion of compensation in the form of stock-based expense, the
cash salary expense included in costs of revenues and operating expenses would be higher which would affect
our cash position.
We compensate for these limitations by reconciling non-GAAP gross profit, non-GAAP operating profit,
non-GAAP net income and non-GAAP earnings per share to the most comparable GAAP financial measure. We
encourage investors and others to review our financial information in its entirety, not to rely on any single
financial measure and to view our non-GAAP financial measures in conjunction with the most comparable
GAAP financial measures.
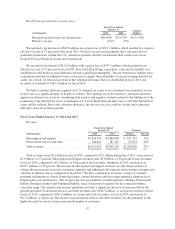
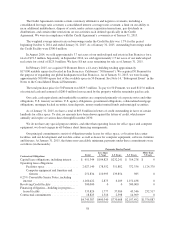
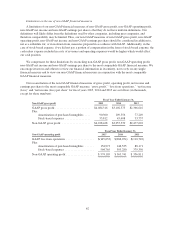
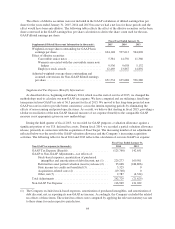
Our reconciliation of the non-GAAP financial measures of gross profit, operating profit, net income and
earnings per share to the most comparable GAAP measure, “gross profit,” “loss from operations,” “net income
(loss)” and “net income (loss) per share” for fiscal years 2015, 2014 and 2013 are as follows (in thousands,
except for share numbers):
Fiscal Year Ended January 31,
Non-GAAP gross profit 2015 2014 2013
GAAP gross profit ........................ $4,084,316 $3,102,575 $2,366,616
Plus:
Amortization of purchased intangibles .... 90,300 109,356 77,249
Stock-based expenses ................. 53,812 45,608 33,757
Non-GAAP gross profit ................... $4,228,428 $3,257,539 $2,477,622
Fiscal Year Ended January 31,
Non-GAAP operating profit 2015 2014 2013
GAAP loss from operations ................... $(145,633) $(286,074) $(110,710)
Plus:
Amortization of purchased intangibles ...... 154,973 146,535 88,171
Stock-based expenses .................... 564,765 503,280 379,350
Non-GAAP operating profit ................... $574,105 $ 363,741 $ 356,811
62