Salesforce.com 2015 Annual Report Download - page 78
Download and view the complete annual report
Please find page 78 of the 2015 Salesforce.com annual report below. You can navigate through the pages in the report by either clicking on the pages listed below, or by using the keyword search tool below to find specific information within the annual report.-
 1
1 -
2
-
3
-
4
-
5
-
6
-
7
-
8
-
9
-
10
-
11
-
12
-
13
-
14
-
15
-
16
-
17
-
18
-
19
-
20
-
21
-
22
-
23
-
24
-
25
-
26
-
27
-
28
-
29
-
30
-
31
-
32
-
33
-
34
-
35
-
36
-
37
-
38
-
39
-
40
-
41
-
42
-
43
-
44
-
45
-
46
-
47
-
48
-
49
-
50
-
51
-
52
-
53
-
54
-
55
-
56
-
57
-
58
-
59
-
60
-
61
-
62
-
63
-
64
-
65
-
66
-
67
-
 68
68 -
 69
69 -
 70
70 -
 71
71 -
 72
72 -
 73
73 -
 74
74 -
 75
75 -
 76
76 -
 77
77 -
 78
78 -
 79
79 -
 80
80 -
 81
81 -
 82
82 -
 83
83 -
 84
84 -
 85
85 -
 86
86 -
 87
87 -
 88
88 -
89
-
90
-
91
-
92
-
93
-
94
-
95
-
96
-
97
-
98
-
99
-
100
-
101
-
102
-
103
-
104
-
105
-
106
-
107
-
108
-
109
-
110
-
111
-
112
-
113
-
114
-
115
-
116
-
117
-
118
-
119
-
120
-
121
-
122
-
123
-
124
-
125
-
126
-
127
-
128
-
129
-
130
-
131
-
132
-
133
-
134
 |
 |

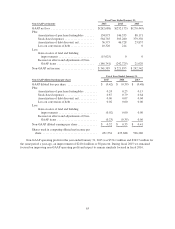
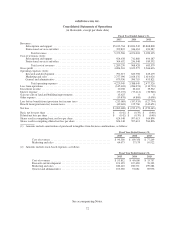
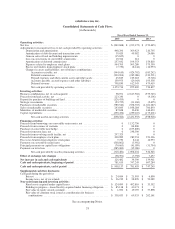
salesforce.com, inc.
Consolidated Statements of Operations
(in thousands, except per share data)
Fiscal Year Ended January 31,
2015 2014 2013
Revenues:
Subscription and support ........................................... $5,013,764 $3,824,542 $2,868,808
Professional services and other ...................................... 359,822 246,461 181,387
Total revenues ............................................... 5,373,586 4,071,003 3,050,195
Cost of revenues (1)(2):
Subscription and support ........................................... 924,638 711,880 494,187
Professional services and other ...................................... 364,632 256,548 189,392
Total cost of revenues ......................................... 1,289,270 968,428 683,579
Gross profit .......................................................... 4,084,316 3,102,575 2,366,616
Operating expenses (1)(2):
Research and development .......................................... 792,917 623,798 429,479
Marketing and sales ............................................... 2,757,096 2,168,132 1,614,026
General and administrative .......................................... 679,936 596,719 433,821
Total operating expenses ....................................... 4,229,949 3,388,649 2,477,326
Loss from operations .................................................. (145,633) (286,074) (110,710)
Investment income .................................................... 10,038 10,218 19,562
Interest expense ...................................................... (73,237) (77,211) (30,948)
Gain on sales of land and building improvements ............................ 15,625 0 0
Other expense ........................................................ (19,878) (4,868) (5,698)
Loss before benefit from (provision for) income taxes ........................ (213,085) (357,935) (127,794)
Benefit from (provision for) income taxes .................................. (49,603) 125,760 (142,651)
Net loss ............................................................. $ (262,688) $ (232,175) $ (270,445)
Basic net loss per share ................................................ $ (0.42) $ (0.39) $ (0.48)
Diluted net loss per share ............................................... $ (0.42) $ (0.39) $ (0.48)
Shares used in computing basic net loss per share ............................ 624,148 597,613 564,896
Shares used in computing diluted net loss per share .......................... 624,148 597,613 564,896
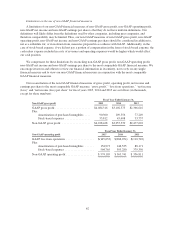
(1) Amounts include amortization of purchased intangibles from business combinations, as follows:
Fiscal Year Ended January 31,
2015 2014 2013
Cost of revenues ............................................. $ 90,300 $ 109,356 $ 77,249
Marketing and sales .......................................... 64,673 37,179 10,922
(2) Amounts include stock-based expenses, as follows:
Fiscal Year Ended January 31,
2015 2014 2013
Cost of revenues ............................................. $ 53,812 $ 45,608 $ 33,757
Research and development ..................................... 121,193 107,420 76,333
Marketing and sales .......................................... 286,410 258,571 199,284
General and administrative ..................................... 103,350 91,681 69,976
See accompanying Notes.
72