Salesforce.com 2015 Annual Report Download - page 62
Download and view the complete annual report
Please find page 62 of the 2015 Salesforce.com annual report below. You can navigate through the pages in the report by either clicking on the pages listed below, or by using the keyword search tool below to find specific information within the annual report.-
 1
1 -
2
-
3
-
4
-
5
-
6
-
7
-
8
-
9
-
10
-
11
-
12
-
13
-
14
-
15
-
16
-
17
-
18
-
19
-
20
-
21
-
22
-
23
-
24
-
25
-
26
-
27
-
28
-
29
-
30
-
31
-
32
-
33
-
34
-
35
-
36
-
37
-
38
-
39
-
40
-
41
-
42
-
43
-
44
-
45
-
46
-
47
-
48
-
49
-
50
-
51
-
 52
52 -
 53
53 -
 54
54 -
 55
55 -
 56
56 -
 57
57 -
 58
58 -
 59
59 -
 60
60 -
 61
61 -
 62
62 -
 63
63 -
 64
64 -
 65
65 -
 66
66 -
 67
67 -
 68
68 -
 69
69 -
 70
70 -
 71
71 -
 72
72 -
73
-
74
-
75
-
76
-
77
-
78
-
79
-
80
-
81
-
82
-
83
-
84
-
85
-
86
-
87
-
88
-
89
-
90
-
91
-
92
-
93
-
94
-
95
-
96
-
97
-
98
-
99
-
100
-
101
-
102
-
103
-
104
-
105
-
106
-
107
-
108
-
109
-
110
-
111
-
112
-
113
-
114
-
115
-
116
-
117
-
118
-
119
-
120
-
121
-
122
-
123
-
124
-
125
-
126
-
127
-
128
-
129
-
130
-
131
-
132
-
133
-
134
 |
 |
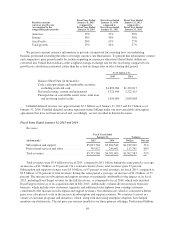
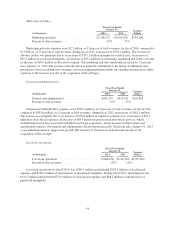
Liquidity and Capital Resources
At January 31, 2015, our principal sources of liquidity were cash, cash equivalents and marketable securities
totaling $1.9 billion, which excludes restricted cash of $115.0 million, and accounts receivable of $1.9 billion.
Net cash provided by operating activities was $1.2 billion during fiscal 2015 and $875.5 million during the
same period a year ago. Cash provided by operating activities has historically been affected by the amount of net
loss adjusted for non-cash expense items such as depreciation and amortization, amortization of purchased
intangibles from business combinations, amortization of debt discount, and the expense associated with stock-
based awards; the reclassification of excess tax benefits from employee stock plans to cash flows from financing
activities; the timing of employee related costs including commissions and bonus payments; the timing of
collections from our customers, which is our largest source of operating cash flows; and changes in working
capital accounts.
Our working capital accounts consist of accounts receivables and prepaid assets and other current assets.
Claims against working capital include accounts payable, accrued expenses and other current liabilities and our
convertible notes. Our working capital may be impacted by factors in future periods, certain amounts and timing
of which are seasonal, such as billings to customers for subscriptions and support services and the subsequent
collection of those billings.
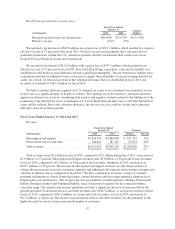
As described above in “Seasonal Nature of Deferred Revenue and Accounts Receivable,” our fourth quarter
has historically been our strongest quarter for new business and renewals. The year on year compounding effect
of this seasonality in both billing patterns and overall business causes the value of invoices that we generate in
the fourth quarter to increase as a proportion of our total annual billings.
We generally invoice our customers for our subscription and services contracts in advance in annual
installments. We typically issue renewal invoices in advance of the renewal service period, and depending on
timing, the initial invoice for the subscription and services contract and the subsequent renewal invoice may
occur in different quarters. Such invoice amounts are initially reflected in accounts receivable and deferred
revenue, which is reflected on the balance sheet. The operating cash flow benefit of increased billing activity
generally occurs in the subsequent quarter when we collect from our customers. As such, our first quarter has
become our largest collections and operating cash flow quarter.
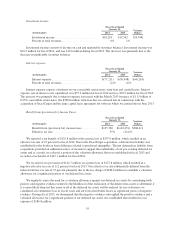
Net cash provided by operating activities during fiscal 2015 increased $298.2 million over the same period a
year ago primarily due to higher net income after adjusting for depreciation and amortization, loss on
conversions of convertible senior notes, stock-based expenses and the timing of payments against accounts
payable, accrued expenses and other current liabilities.
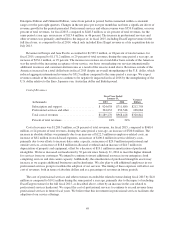
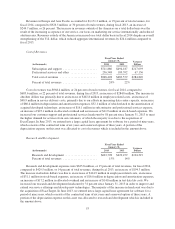
Net cash used in investing activities was $698.4 million during fiscal 2015 and $2.4 billion during the same
period a year ago. The net cash used in investing activities during fiscal 2015 primarily related to capital
expenditures, including new office build-outs, investment of cash balances and strategic investments offset by
proceeds from sales and maturities of marketable securities. Net cash used in investing activities during fiscal
2015 decreased by $1.7 billion over the same period a year ago primarily due to cash used for the acquisitions of
ExactTarget, Inc. and EdgeSpring, Inc. during fiscal 2014, offset by cash proceeds from sales of land and
building improvements totaling $223.2 million and cash acquired of $38.1 million from business combinations
during fiscal 2015. Additionally, we made deposits totaling $126.4 million for the purchase of building and land
during fiscal 2015.
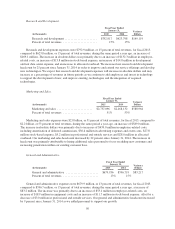
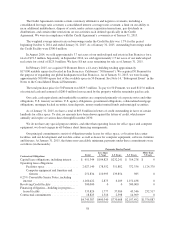
Net cash used in financing activities was $310.5 million during fiscal 2015 as compared to net cash
provided by financing activities of $1.6 billion during the same period a year ago. Net cash used in financing
activities during fiscal 2015 consisted primarily of $568.9 million in principal payments on our 0.75%
convertible senior notes, $70.7 million of principal payments on capital leases and $285.0 million of payments on
our term loan, offset by $309.0 million from proceeds from equity plans and $297.3 million from our revolving
56