Royal Caribbean Cruise Lines 2010 Annual Report Download - page 81
Download and view the complete annual report
Please find page 81 of the 2010 Royal Caribbean Cruise Lines annual report below. You can navigate through the pages in the report by either clicking on the pages listed below, or by using the keyword search tool below to find specific information within the annual report.-
 1
1 -
2
-
3
-
4
-
5
-
6
-
7
-
8
-
9
-
10
-
11
-
12
-
13
-
14
-
15
-
16
-
17
-
18
-
19
-
20
-
21
-
22
-
23
-
24
-
25
-
26
-
27
-
28
-
29
-
30
-
31
-
32
-
33
-
34
-
35
-
36
-
37
-
38
-
39
-
40
-
41
-
42
-
43
-
44
-
45
-
46
-
47
-
48
-
49
-
50
-
51
-
52
-
53
-
54
-
55
-
56
-
57
-
58
-
59
-
60
-
61
-
62
-
63
-
64
-
65
-
66
-
67
-
68
-
69
-
70
-
 71
71 -
 72
72 -
 73
73 -
 74
74 -
 75
75 -
 76
76 -
 77
77 -
 78
78 -
 79
79 -
 80
80 -
 81
81 -
 82
82 -
 83
83 -
 84
84 -
 85
85 -
 86
86 -
 87
87 -
 88
88 -
 89
89 -
 90
90 -
 91
91 -
92
 |
 |

2010 ANNUAL REPORT 78
NOTES TO THE CONSOLIDATED FINANCIAL STATEMENTS
Non-Financial Assets and Liabilities Measured at
Fair Value on a Non-Recurring Basis
During 2009, we classified the Atlantic Star as held for
sale and recognized a charge of $7.1 million to reduce
the carrying value of the ship to its fair value less cost
to sell based on a firm offer received during 2009.
This amount was recorded within other operating
expenses in our consolidated statement of operations.
We determined the fair market value of the Atlantic
Star as of December 31, 2010 based on comparable
ship sales adjusted for the condition, age and size of
the ship. We have categorized these inputs as Level 3
because they are largely based on our own assump-
tions. As of December 31, 2010, the carrying amount
of the Atlantic Star which we still believe represents
its fair value was $46.4 million.
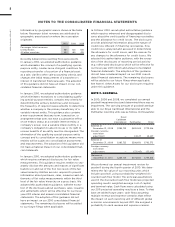
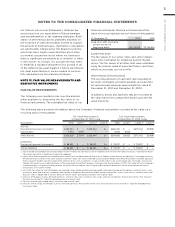
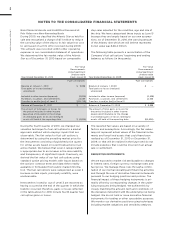
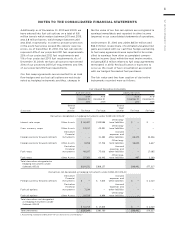
The following table presents a reconciliation of the
Company’s fuel call options’ beginning and ending
balances as follows (in thousands):
Fair Value Fair Value
Measurements Measurements
Using Significant Using Significant
Unobservable Unobservable
Year Ended December 31, 2010 Inputs (Level 3) Year Ended December 31, 2009 Inputs (Level 3)
Fuel Call Options Fuel Call Options
Balance at January 1, 2010 Balance at January 1, 2009 —
Total gains or losses (realized/
unrealized)
Total gains or losses (realized/
unrealized)
Included in other income (expense) () Included in other income (expense) ()
Purchases, issuances, and settlements Purchases, issuances, and settlements
Transfers in and/or (out) of Level 3 () Transfers in and/or (out) of Level 3 —
Balance at December 31, 2010 — Balance at December 31, 2009
The amount of total gains or losses for
the period included in other income
(expense) attributable to the change
in unrealized gains or losses relating to
assets still held at the reporting date ()
The amount of total gains or losses for
the period included in other income
(expense) attributable to the change
in unrealized gains or losses relating to
assets still held at the reporting date ()
During the fourth quarter of 2010, we changed our
valuation technique for fuel call options to a market
approach method which employs inputs that are
observable. The fair value for fuel call options is
determined by using the prevailing market price for
the instruments consisting of published price quotes
for similar assets based on recent transactions in an
active market. We believe that Level 2 categorization
is appropriate due to an increase in the observability
and transparency of significant inputs. Previously, we
derived the fair value of our fuel call options using
standard option pricing models with inputs based on
the options’ contract terms and data either readily
available or formulated from public market informa-
tion. The fuel call options were categorized as Level 3
because certain inputs, principally volatility, were
unobservable.
Net transfers in and/or out of Level 3 are reported as
having occurred at the end of the quarter in which the
transfer occurred; therefore, gains or losses reflected
in the table above for 2010 include fourth quarter fuel
call option gains or losses.
The reported fair values are based on a variety of
factors and assumptions. Accordingly, the fair values
may not represent actual values of the financial instru-
ments and long-lived assets that could have been
realized as of December 31, 2010 or December 31,
2009, or that will be realized in the future and do not
include expenses that could be incurred in an actual
sale or settlement.
DERIVATIVE INSTRUMENTS
We are exposed to market risk attributable to changes
in interest rates, foreign currency exchange rates and
fuel prices. We manage these risks through a combi-
nation of our normal operating and financing activities
and through the use of derivative financial instruments
pursuant to our hedging practices and policies. The
financial impact of these hedging instruments is pri-
marily offset by corresponding changes in the under-
lying exposures being hedged. We achieve this by
closely matching the amount, term and conditions of
the derivative instrument with the underlying risk being
hedged. We do not hold or issue derivative financial
instruments for trading or other speculative purposes.
We monitor our derivative positions using techniques
including market valuations and sensitivity analyses.