Royal Caribbean Cruise Lines 2010 Annual Report Download - page 47
Download and view the complete annual report
Please find page 47 of the 2010 Royal Caribbean Cruise Lines annual report below. You can navigate through the pages in the report by either clicking on the pages listed below, or by using the keyword search tool below to find specific information within the annual report.-
 1
1 -
2
-
3
-
4
-
5
-
6
-
7
-
8
-
9
-
10
-
11
-
12
-
13
-
14
-
15
-
16
-
17
-
18
-
19
-
20
-
21
-
22
-
23
-
24
-
25
-
26
-
27
-
28
-
29
-
30
-
31
-
32
-
33
-
34
-
35
-
36
-
 37
37 -
 38
38 -
 39
39 -
 40
40 -
 41
41 -
 42
42 -
 43
43 -
 44
44 -
 45
45 -
 46
46 -
 47
47 -
 48
48 -
 49
49 -
 50
50 -
 51
51 -
 52
52 -
 53
53 -
 54
54 -
 55
55 -
 56
56 -
 57
57 -
58
-
59
-
60
-
61
-
62
-
63
-
64
-
65
-
66
-
67
-
68
-
69
-
70
-
71
-
72
-
73
-
74
-
75
-
76
-
77
-
78
-
79
-
80
-
81
-
82
-
83
-
84
-
85
-
86
-
87
-
88
-
89
-
90
-
91
-
92
 |
 |
2010 ANNUAL REPORT 44
PART II
• As of December 31, 2010, our liquidity was $1.6 bil-
lion, including cash and the undrawn portion of our
unsecured revolving credit facilities. During 2010,
we entered into a $525.0 million unsecured revolv-
ing credit facility bearing interest at LIBOR plus a
margin of 2.75% and a facility fee of 0.6875% due
2014. Going forward, we anticipate maintaining two
separate revolving credit facilities with staggered
maturity dates.
• We took delivery of Allure of the Seas, the second
Oasis-class ship for Royal Caribbean International
and Celebrity Eclipse, the third Solstice-class ship
for Celebrity Cruises. To finance the purchases, we
borrowed a total of $1.7 billion under unsecured
term loans.
• In an effort to increase our fixed percentage of debt,
we terminated certain of our interest rate and cross
currency swap agreements which resulted in net
cash proceeds of approximately $115.4 million. In
addition, we terminated 22.9% of our fuel swap
agreements as of June 30, 2010 which resulted in
net cash proceeds of $57.5 million.
Other Items:
• During 2010, we sold Bleu de France to an unrelated
party for $55.0 million and in the first quarter of
2011, we entered into an agreement to sell Celebrity
Mercury to TUI Cruises for €234.3 million. We exe-
cuted certain forward contracts to lock in the sales
price at approximately $290.0 million. The sale of
Bleu de France resulted in an immaterial deferred
gain. We anticipate recognizing a gain on the sale of
Celebrity Mercury which we do not expect will have
a material effect on our 2011 results of operations.
• In February 2011, we reached a conditional agreement
with Meyer Werft to build the first of a new genera-
tion of Royal Caribbean International cruise ships.
The ship will have a capacity of approximately 4,100
berths based on double occupancy and is expected
to enter service in the fourth quarter of 2014. We
also have an option to construct a second ship of
the same class which will expire on February 28,
2012, subject to earlier acceleration under certain
circumstances.
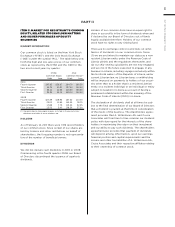
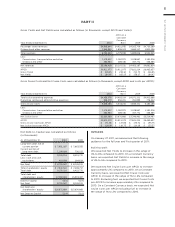
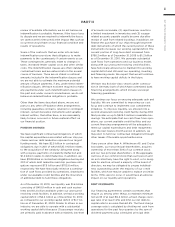
We reported historical total revenues, operating income,
net income and earnings per share as shown in the
following table (in thousands, except per share data):
Year Ended
December 31,
Total revenues
Operating income
Net income
Basic earnings
per share:
Net income
Diluted earnings
per share:
Net income
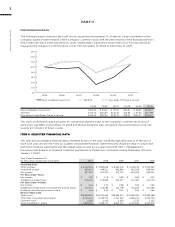
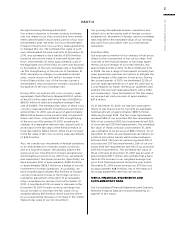
The following table presents historical operating
data as a percentage of total revenues for the last
three years:
Year Ended December 31,
Passenger ticket revenues
Onboard and other revenues
Total revenues
Cruise operating expenses
Commissions, transportation
and other
Onboard and other
Payroll and related
Food
Fuel
Other operating
Total cruise operating expenses
Marketing, selling and
administrative expenses
Depreciation and amortization
expenses
Operating income
Other expense () () ()
Net income
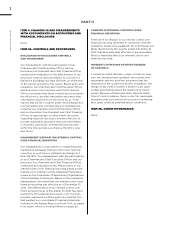
Selected historical statistical information is shown in
the following table:
Year Ended
December 31,
Passengers Carried
Passenger Cruise
Days
APCD
Occupancy