Royal Caribbean Cruise Lines 2010 Annual Report Download - page 8
Download and view the complete annual report
Please find page 8 of the 2010 Royal Caribbean Cruise Lines annual report below. You can navigate through the pages in the report by either clicking on the pages listed below, or by using the keyword search tool below to find specific information within the annual report.-
 1
1 -
 2
2 -
 3
3 -
 4
4 -
 5
5 -
 6
6 -
 7
7 -
 8
8 -
 9
9 -
 10
10 -
 11
11 -
 12
12 -
 13
13 -
 14
14 -
 15
15 -
 16
16 -
 17
17 -
 18
18 -
 19
19 -
20
-
21
-
22
-
23
-
24
-
25
-
26
-
27
-
28
-
29
-
30
-
31
-
32
-
33
-
34
-
35
-
36
-
37
-
38
-
39
-
40
-
41
-
42
-
43
-
44
-
45
-
46
-
47
-
48
-
49
-
50
-
51
-
52
-
53
-
54
-
55
-
56
-
57
-
58
-
59
-
60
-
61
-
62
-
63
-
64
-
65
-
66
-
67
-
68
-
69
-
70
-
71
-
72
-
73
-
74
-
75
-
76
-
77
-
78
-
79
-
80
-
81
-
82
-
83
-
84
-
85
-
86
-
87
-
88
-
89
-
90
-
91
-
92
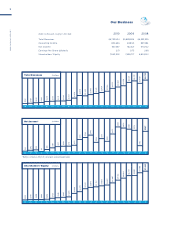
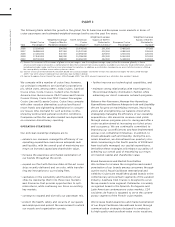
 |
 |
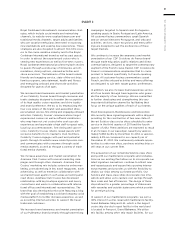
$523
$567
$698
$760
$1,013
$1,113
$1,171
$1,184
$1,357
$1,939
$2,636
$2,546
$2,866
$3,145
$3,434
$3,784
$4,555
$4,903
$5,230
$6,149
$6,533
$5,890
$6,753
09080706050403020100999897969594939291908988 10
Total Revenues $ millions
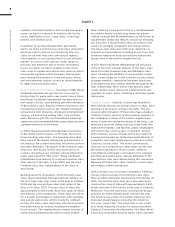
$14
$42
$52
$4
$61
$107
$137
$149
$151
$175
$331
$384
$445
$254
$351
$281
$475
$663
$634
$603
$574
$162
$547
09080706050403020100999897969594939291908988 10
Net Income* $ millions
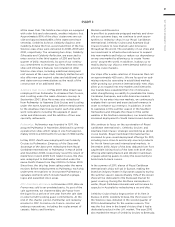
$295
$348
$400
$404
$464
$733
$846
$965
$1,085
$2,019
$2,455
$3,261
$3,616
$3,757
$4,035
$4,263
$4,805
$5,554
$6,092
$6,757
$6,803
$7,500
$7,943
09080706050403020100999897969594939291908988 10
Shareholders’ Equity $ millions
*Before cumulative eect of a change in accounting principle
2010 ANNUAL REPORT 4
Our Business
dollars in thousands, except per share data 2010 2009 2008
Total Revenues $6,752,504 $5,889,826 $6,532,525
Operating Income 802,633 488,511 831,984
Net Income 547,467 162,421 573,722
Earnings Per Share (diluted) 2.51 0.75 2.68
Shareholders’ Equity 7,942,502 7,499,717 6,803,012