Royal Caribbean Cruise Lines 2010 Annual Report Download - page 51
Download and view the complete annual report
Please find page 51 of the 2010 Royal Caribbean Cruise Lines annual report below. You can navigate through the pages in the report by either clicking on the pages listed below, or by using the keyword search tool below to find specific information within the annual report.-
 1
1 -
2
-
3
-
4
-
5
-
6
-
7
-
8
-
9
-
10
-
11
-
12
-
13
-
14
-
15
-
16
-
17
-
18
-
19
-
20
-
21
-
22
-
23
-
24
-
25
-
26
-
27
-
28
-
29
-
30
-
31
-
32
-
33
-
34
-
35
-
36
-
37
-
38
-
39
-
40
-
 41
41 -
 42
42 -
 43
43 -
 44
44 -
 45
45 -
 46
46 -
 47
47 -
 48
48 -
 49
49 -
 50
50 -
 51
51 -
 52
52 -
 53
53 -
 54
54 -
 55
55 -
 56
56 -
 57
57 -
 58
58 -
 59
59 -
 60
60 -
 61
61 -
62
-
63
-
64
-
65
-
66
-
67
-
68
-
69
-
70
-
71
-
72
-
73
-
74
-
75
-
76
-
77
-
78
-
79
-
80
-
81
-
82
-
83
-
84
-
85
-
86
-
87
-
88
-
89
-
90
-
91
-
92
 |
 |

2010 ANNUAL REPORT 48
PART II
YEAR ENDED DECEMBER 31, 2009 COMPARED TO
YEAR ENDED DECEMBER 31, 2008
In this section, references to 2009 refer to the year
ended December 31, 2009 and references to 2008
refer to the year ended December 31, 2008.
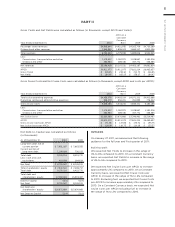
Revenues
Total revenues for 2009 decreased $642.7 million or
9.8% to $5.9 billion from $6.5 billion in 2008. This
decrease is primarily due to higher discounts on our
ticket prices, and to a lesser extent a decrease in
onboard spending and the adverse effect of foreign
currency as a result of a stronger United States dollar
against the euro, British pound and Canadian dollar
compared to 2008. Our revenues were also adversely
impacted by a decrease in occupancy from 104.5% in
2008 compared to 102.5% in 2009. The decrease in
occupancy was driven by the current worldwide eco-
nomic environment with disproportionate pressure
within the Spanish market. In addition, the adverse
impact of the H1N1 virus resulted in selective itinerary
modifications and diminished demand for our cruises
to Mexico and the Caribbean. This revenue decrease
was partially offset by an estimated increase of approx-
imately $335.0 million attributable to an increase in
capacity of 5.1%. Although the number of passengers
carried in 2009 decreased as compared to 2008, on
average, passengers sailed more days per voyage in
2009 as compared to 2008 due to certain itinerary
changes. The increase in capacity is primarily due to a
full year of service of Celebrity Solstice, which entered
service in November 2008, a full year of service of
Independence of the Seas, which entered service in
May 2008, the addition of Celebrity Equinox, which
entered service in July 2009, the addition of Pacific
Dream, which entered service in May 2009 as part of
the termination of the charter to Island Cruises, a full
year of service of Ocean Dream, which entered ser-
vice in March 2008 and the addition of Oasis of the
Seas, which entered service in December 2009. This
increase in capacity was partially offset by the sale of
Celebrity Galaxy to TUI Cruises in March 2009, the
sale of Oceanic in April 2009 and the Atlantic Star
which is no longer in operation.
Onboard and other revenues included concession rev-
enues of $215.6 million in 2009 compared to $230.8
million for the same period in 2008. The decrease in
concession revenues was primarily due to a decrease
in spending on a per passenger basis, partially offset
by the increase in capacity mentioned above.
Cruise Operating Expenses
Total cruise operating expenses for 2009 decreased
$332.6 million or 7.6% to $4.1 billion from $4.4 billion
for 2008. This decrease was primarily due to a decrease
in commissions as a result of discounted ticket prices,
a decrease in air expense due to a reduction in guests
booking air service through us, a decrease in trans-
portation and lodging expenses related to certain itin-
erary changes, and the impact of the stronger United
States dollar against the euro, British pound and
Canadian dollar compared to 2008. In addition, fuel
expenses, which are net of the financial impact of fuel
swap agreements, decreased 17.9% per metric ton in
2009 as compared to 2008 primarily as a result of
lower fuel prices. To a lesser extent, the decrease was
also related to a decrease in tour and air expenses.
These decreases were partially offset by the increase
in capacity mentioned above.
Marketing, Selling and Administrative Expenses
Marketing, selling and administrative expenses for
2009 decreased $14.5 million or 1.9% to $762.0 million
from $776.5 million for 2008. The decrease is mainly
due to the impact of our cost-containment initiatives
and to termination benefits of $9.0 million incurred
during 2008 that did not recur in 2009. The decrease
was partially offset by an increase in marketing and
selling expenses associated with our international
expansion.
Depreciation and Amortization Expenses
Depreciation and amortization expenses for 2009
increased $47.8 million or 9.2% to $568.2 million from
$520.4 million for 2008. The increase is primarily due
to a full year of service of Celebrity Solstice, a full
year of service of Independence of the Seas and the
addition of Celebrity Equinox. To a lesser extent, the
increase is also due to depreciation associated with
shipboard and shore-side additions. These increases
were partially offset by the sale of Celebrity Galaxy
to TUI Cruises.
Other Income (Expense)
Interest expense, net of interest capitalized, decreased
to $300.0 million in 2009 from $327.3 million in 2008.
Gross interest expense decreased to $341.1 million in
2009 from $371.7 million in 2008. The decrease was
primarily due to lower interest rates, partially offset
by a higher average debt level. Interest capitalized
decreased to $41.1 million in 2009 from $44.4 million
in 2008 primarily due to lower interest rates.
Other expense increased to $33.1 million in 2009
compared to other income of $54.9 million in 2008
for a net change of $88.0 million when comparing
these periods. The change was primarily due to $21.1
million in foreign currency exchange losses in 2009
as compared to $23.0 million in foreign currency
exchange gains in 2008, for a net change of $44.1
million when comparing these periods. This change
was primarily due to the dramatic movements in
exchange rates during the latter half of 2008 and
most of 2009. In addition, we had $15.2 million in
losses from our equity method investments in 2009
as compared to $4.0 million in gains from our equity