Royal Caribbean Cruise Lines 2010 Annual Report Download - page 45
Download and view the complete annual report
Please find page 45 of the 2010 Royal Caribbean Cruise Lines annual report below. You can navigate through the pages in the report by either clicking on the pages listed below, or by using the keyword search tool below to find specific information within the annual report.-
 1
1 -
2
-
3
-
4
-
5
-
6
-
7
-
8
-
9
-
10
-
11
-
12
-
13
-
14
-
15
-
16
-
17
-
18
-
19
-
20
-
21
-
22
-
23
-
24
-
25
-
26
-
27
-
28
-
29
-
30
-
31
-
32
-
33
-
34
-
 35
35 -
 36
36 -
 37
37 -
 38
38 -
 39
39 -
 40
40 -
 41
41 -
 42
42 -
 43
43 -
 44
44 -
 45
45 -
 46
46 -
 47
47 -
 48
48 -
 49
49 -
 50
50 -
 51
51 -
 52
52 -
 53
53 -
 54
54 -
 55
55 -
56
-
57
-
58
-
59
-
60
-
61
-
62
-
63
-
64
-
65
-
66
-
67
-
68
-
69
-
70
-
71
-
72
-
73
-
74
-
75
-
76
-
77
-
78
-
79
-
80
-
81
-
82
-
83
-
84
-
85
-
86
-
87
-
88
-
89
-
90
-
91
-
92
 |
 |

2010 ANNUAL REPORT 42
PART II
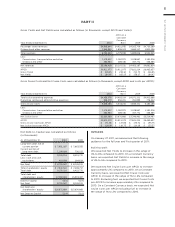
Gross Cruise Costs represent the sum of total cruise
operating expenses plus marketing, selling and admin-
istrative expenses.
Gross Yields represent total revenues per APCD.
Net Cruise Costs represent Gross Cruise Costs exclud-
ing commissions, transportation and other expenses
and onboard and other expenses (each of which is
described above under the Description of Certain Line
Items heading). In measuring our ability to control
costs in a manner that positively impacts net income,
we believe changes in Net Cruise Costs to be the most
relevant indicator of our performance. A reconciliation
of historical Gross Cruise Costs to Net Cruise Costs is
provided below under Results of Operations. We have
not provided a quantitative reconciliation of projected
Gross Cruise Costs to projected Net Cruise Costs due
to the significant uncertainty in projecting the costs
deducted to arrive at this measure. Accordingly, we
do not believe that reconciling information for such
projected figures would be meaningful.
Net Debt-to-Capital is a ratio which represents total
long-term debt, including current portion of long-term
debt, less cash and cash equivalents (“Net Debt”)
divided by the sum of Net Debt and total shareholders’
equity. We believe Net Debt and Net Debt-to-Capital,
along with total long-term debt and shareholders’
equity are useful measures of our capital structure.
A reconciliation of historical Debt-to-Capital to Net
Debt-to-Capital is provided below under Results of
Operations.
Net Revenues represent total revenues less commis-
sions, transportation and other expenses and onboard
and other expenses (each of which is described under
the Description of Certain Line Items heading).
Net Yields represent Net Revenues per APCD. We uti-
lize Net Revenues and Net Yields to manage our busi-
ness on a day-to-day basis as we believe that it is the
most relevant measure of our pricing performance
because it reflects the cruise revenues earned by us
net of our most significant variable costs, which are
commissions, transportation and other expenses and
onboard and other expenses. A reconciliation of his-
torical Gross Yields to Net Yields is provided below
under Results of Operations. We have not provided a
quantitative reconciliation of projected Gross Yields
to projected Net Yields due to the significant uncer-
tainty in projecting the costs deducted to arrive at
this measure. Accordingly, we do not believe that rec-
onciling information for such projected figures would
be meaningful.
Occupancy, in accordance with cruise vacation indus-
try practice, is calculated by dividing Passenger
Cruise Days by APCD. A percentage in excess of 100%
indicates that three or more passengers occupied
some cabins.
Passenger Cruise Days represent the number of pas-
sengers carried for the period multiplied by the number
of days of their respective cruises.
We believe Net Yields and Net Cruise Costs are our
most relevant non-GAAP financial measures. However,
a significant portion of our revenue and expenses are
denominated in currencies other than the United
States dollar. Because our reporting currency is the
United States dollar, the value of these revenues and
expenses can be affected by changes in currency
exchange rates. Although such changes in local cur-
rency prices is just one of many elements impacting
our revenues and expenses, it can be an important
element. For this reason, we also monitor Net Yields
and Net Cruise Costs as if the current periods’ cur-
rency exchange rates had remained constant with the
comparable prior periods’ rates, or on a “Constant
Currency” basis.
It should be emphasized that Constant Currency is
primarily used for comparing short-term changes
and/or projections. Over the longer term, changes in
guest sourcing and shifting the amount of purchases
between currencies significantly change the impact
of the purely currency based fluctuations.
The use of certain significant non-GAAP measures,
such as Net Yields and Net Cruise Costs, allow us to
perform capacity and rate analysis to separate the
impact of known capacity changes from other less
predictable changes which affect our business. We
believe these non-GAAP measures provide expanded
insight to measure revenue and cost performance in
addition to the standard United States GAAP based
financial measures. There are no specific rules or reg-
ulations for determining non-GAAP measures, and as
such, there exists the possibility that they may not be
comparable to other companies within the industry.
EXECUTIVE OVERVIEW
During 2010, we saw a slight improvement in the
economy which led to pricing increases as described
below. Although we are not back at pre-recession
levels, the current demand for our brands is improv-
ing and we expect this trend to continue through 2011.
Profitability momentum and yield accretion are also