Royal Caribbean Cruise Lines 2010 Annual Report Download - page 78
Download and view the complete annual report
Please find page 78 of the 2010 Royal Caribbean Cruise Lines annual report below. You can navigate through the pages in the report by either clicking on the pages listed below, or by using the keyword search tool below to find specific information within the annual report.-
 1
1 -
2
-
3
-
4
-
5
-
6
-
7
-
8
-
9
-
10
-
11
-
12
-
13
-
14
-
15
-
16
-
17
-
18
-
19
-
20
-
21
-
22
-
23
-
24
-
25
-
26
-
27
-
28
-
29
-
30
-
31
-
32
-
33
-
34
-
35
-
36
-
37
-
38
-
39
-
40
-
41
-
42
-
43
-
44
-
45
-
46
-
47
-
48
-
49
-
50
-
51
-
52
-
53
-
54
-
55
-
56
-
57
-
58
-
59
-
60
-
61
-
62
-
63
-
64
-
65
-
66
-
67
-
 68
68 -
 69
69 -
 70
70 -
 71
71 -
 72
72 -
 73
73 -
 74
74 -
 75
75 -
 76
76 -
 77
77 -
 78
78 -
 79
79 -
 80
80 -
 81
81 -
 82
82 -
 83
83 -
 84
84 -
 85
85 -
 86
86 -
 87
87 -
 88
88 -
89
-
90
-
91
-
92
 |
 |

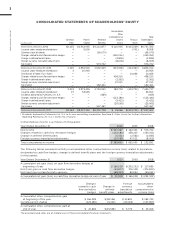
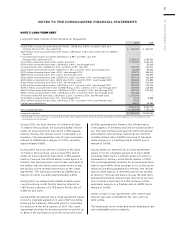
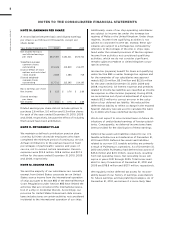
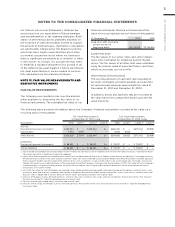
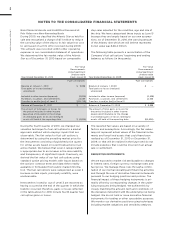
NOTES TO THE CONSOLIDATED FINANCIAL STATEMENTS
ROYAL CARIBBEAN CRUISES LTD. 75
The fair value of each stock option grant is estimated
on the date of grant using the Black-Scholes option-
pricing model. The estimated fair value of stock
options, less estimated forfeitures, is amortized over
the vesting period using the graded-vesting method.
The assumptions used in the Black-Scholes option-
pricing model are as follows:
Dividend yield
Expected stock price
volatility
Risk-free interest rate
Expected option life 6 years 5 years 5 years
Expected volatility was based on a combination of
historical and implied volatilities. The risk-free interest
rate was based on United States Treasury zero coupon
issues with a remaining term equal to the expected
option life assumed at the date of grant. The expected
term was calculated based on historical experience
and represents the time period options actually remain
outstanding. We estimate forfeitures based on histori-
cal pre-vesting forfeiture rates and revise those esti-
mates as appropriate to reflect actual experience. In
2008, we increased our estimated forfeiture rate from
4% for options and 8.5% for restricted stock units to
20% to reflect changes in employee retention rates.
This resulted in a benefit of approximately $9.2 million
in 2008, of which approximately $8.2 million and
$1.0 million was included within marketing, selling
and administrative expenses and payroll and related
expenses, respectively.
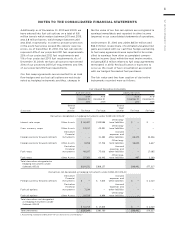
Stock options activity and information about stock options outstanding are summarized in the following tables:
Stock Options Activity
Weighted-
Weighted- Average
Average Remaining Aggregate
Number of Exercise Contractual Intrinsic Value1
Options Price Term (years) (in thousands)
Outstanding at January 1, 2010
Granted
Exercised ()
Canceled ()
Outstanding at December 31, 2010
Vested and expected to vest at December 31, 2010
Options Exercisable at December 31, 2010
1 The intrinsic value represents the amount by which the fair value of stock exceeds the option exercise price as of December 31, 2010.
The weighted-average estimated fair value of stock
options granted was $11.69, $3.68 and $8.72 during
the years ended December 31, 2010, 2009 and 2008,
respectively. The total intrinsic value of stock options
exercised during the years ended December 31, 2010,
2009 and 2008 was $26.9 million, $0.5 million and
$2.0 million, respectively. As of December 31, 2010,
there was approximately $7.2 million of total unrecog-
nized compensation cost, net of estimated forfeitures,
related to stock options granted under our stock
incentive plans which is expected to be recognized
over a weighted-average period of 1.2 years.
Restricted stock units are converted into shares of
common stock upon vesting on a one-for-one basis.
The cost of these awards is determined using the fair
value of our common stock on the date of the grant,
and compensation expense is recognized over the
vesting period. Restricted stock activity is summarized
in the following table:
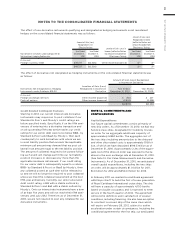
Restricted Stock Activity
Weighted-
Average
Number Grant Date
of Awards Fair Value
Non-vested share units at
January 1, 2010
Granted
Vested ()
Canceled ()
Non-vested share units
expected to vest as of
December 31, 2010
The weighted-average estimated fair value of restricted
stock units granted during the year ended December 31,
2009, and 2008 were $18.26 and $36.24, respectively.
As of December 31, 2010, we had $8.5 million of total
unrecognized compensation expense, net of estimated
forfeitures, related to restricted stock unit grants,
which will be recognized over the weighted-average
period of 1.2 years.