Royal Caribbean Cruise Lines 2010 Annual Report Download - page 74
Download and view the complete annual report
Please find page 74 of the 2010 Royal Caribbean Cruise Lines annual report below. You can navigate through the pages in the report by either clicking on the pages listed below, or by using the keyword search tool below to find specific information within the annual report.-
 1
1 -
2
-
3
-
4
-
5
-
6
-
7
-
8
-
9
-
10
-
11
-
12
-
13
-
14
-
15
-
16
-
17
-
18
-
19
-
20
-
21
-
22
-
23
-
24
-
25
-
26
-
27
-
28
-
29
-
30
-
31
-
32
-
33
-
34
-
35
-
36
-
37
-
38
-
39
-
40
-
41
-
42
-
43
-
44
-
45
-
46
-
47
-
48
-
49
-
50
-
51
-
52
-
53
-
54
-
55
-
56
-
57
-
58
-
59
-
60
-
61
-
62
-
63
-
 64
64 -
 65
65 -
 66
66 -
 67
67 -
 68
68 -
 69
69 -
 70
70 -
 71
71 -
 72
72 -
 73
73 -
 74
74 -
 75
75 -
 76
76 -
 77
77 -
 78
78 -
 79
79 -
 80
80 -
 81
81 -
 82
82 -
 83
83 -
 84
84 -
85
-
86
-
87
-
88
-
89
-
90
-
91
-
92
 |
 |

NOTES TO THE CONSOLIDATED FINANCIAL STATEMENTS
ROYAL CARIBBEAN CRUISES LTD. 71
We discounted the projected cash flows using rates
specific to each reporting unit based on their respec-
tive weighted-average cost of capital. Based on the
probability-weighted discounted cash flows of each
reporting unit we determined the fair values of Royal
Caribbean International and Pullmantur exceeded
their carrying values. Therefore, we did not proceed
to step two of the impairment analysis and we do not
consider goodwill to be impaired.
The estimation of fair value utilizing discounted
expected future cash flows includes numerous uncer-
tainties which require our significant judgment when
making assumptions of expected revenues, operating
costs, marketing, selling and administrative expenses,
interest rates, ship additions and retirements as well
as assumptions regarding the cruise vacation industry
competition and general economic and business con-
ditions, among other factors. The Spanish economy
has been harder impacted than most other economies
around the world where we operate and there is
significant uncertainty as to whether or when it will
recover. If that economy weakens more than contem-
plated in our discounted cash flow model, that could
trigger an impairment charge. The Pullmantur report-
ing unit’s fair value exceeded its carrying value by
37% as of December 31, 2010. It is reasonably possible
that significant changes to our projected operating
results utilized in the impairment analysis, especially
our future net yield assumptions, could lead to an
impairment of the Pullmantur reporting unit’s goodwill.
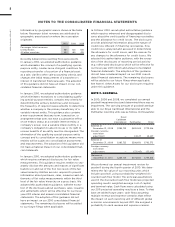
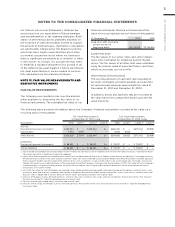
NOTE 4. INTANGIBLE ASSETS
Intangible assets consist of the following (in thousands):
Indefinite-life intangible asset—
Pullmantur trademarks and
trade names
Foreign currency translation
adjustment ()
Total
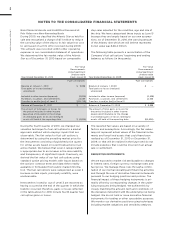
We performed the annual impairment review of our
trademarks and trade names during the fourth quarter
of 2010 using a discounted cash flow model and the
relief-from-royalty method. The royalty rate used is
based on comparable royalty agreements in the tour-
ism and hospitality industry. We used the same dis-
count rate used in valuing the Pullmantur reporting
unit in our goodwill impairment test. Based on the
discounted cash flow model, we determined the fair
value of our trademarks and trade names exceeded
their carrying value by 19% at December 31, 2010.
The Spanish economy has been harder impacted than
most other economies around the world where we
trade and there is significant uncertainty as to whether
or when it will recover. It is reasonably possible that
significant changes to our projected operating results
utilized in the impairment analysis, especially our
future net yield assumptions, could lead to an impair-
ment of our trademarks and trade names.
Finite-life intangible assets and related accumulated
amortization are immaterial to our 2010, 2009, and
2008 consolidated financial statements.
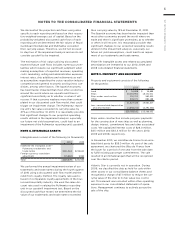
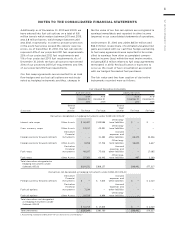
NOTE 5. PROPERTY AND EQUIPMENT
Property and equipment consists of the following
(in thousands):
Land
Ships
Ships under construction
Other
Less—accumulated depreciation
and amortization () ()
Ships under construction include progress payments
for the construction of new ships as well as planning,
design, interest, commitment fees and other associated
costs. We capitalized interest costs of $26.0 million,
$41.1 million and $44.4 million for the years 2010,
2009 and 2008, respectively.
In November 2010, we sold Bleu de France to an unre-
lated third party for $55.0 million. As part of the sale
agreement, we chartered the Bleu de France from
the buyer for a period of one year from the sale date
to fulfill existing passenger commitments. The sale
resulted in an immaterial gain that will be recognized
over the charter period.
Atlantic Star is currently not in operation. During
2009, we classified the ship as held for sale within
other assets in our consolidated balance sheets and
recognized a charge of $7.1 million to reduce the car-
rying value of the ship to its fair value less cost to
sell. This amount was recorded within other operating
expenses in our consolidated statements of opera-
tions. Management continues to actively pursue the
sale of the ship.