Royal Caribbean Cruise Lines 2010 Annual Report Download - page 46
Download and view the complete annual report
Please find page 46 of the 2010 Royal Caribbean Cruise Lines annual report below. You can navigate through the pages in the report by either clicking on the pages listed below, or by using the keyword search tool below to find specific information within the annual report.-
 1
1 -
2
-
3
-
4
-
5
-
6
-
7
-
8
-
9
-
10
-
11
-
12
-
13
-
14
-
15
-
16
-
17
-
18
-
19
-
20
-
21
-
22
-
23
-
24
-
25
-
26
-
27
-
28
-
29
-
30
-
31
-
32
-
33
-
34
-
35
-
 36
36 -
 37
37 -
 38
38 -
 39
39 -
 40
40 -
 41
41 -
 42
42 -
 43
43 -
 44
44 -
 45
45 -
 46
46 -
 47
47 -
 48
48 -
 49
49 -
 50
50 -
 51
51 -
 52
52 -
 53
53 -
 54
54 -
 55
55 -
 56
56 -
57
-
58
-
59
-
60
-
61
-
62
-
63
-
64
-
65
-
66
-
67
-
68
-
69
-
70
-
71
-
72
-
73
-
74
-
75
-
76
-
77
-
78
-
79
-
80
-
81
-
82
-
83
-
84
-
85
-
86
-
87
-
88
-
89
-
90
-
91
-
92
 |
 |

PART II
ROYAL CARIBBEAN CRUISES LTD. 43
quite strong with our newest vessels performing well
and our management team effectively controlling
costs. During 2010, our Net Yields increased 4.2% and
our Net Cruise Costs per APCD decreased by 1.8%
despite experiencing travel disruptions, extreme
weather conditions and currency related issues during
the year. Even though the economy remains a chal-
lenge our outlook remains encouraging.
During 2011, we will work to further enhance our reve-
nues with the overall goal of maximizing our return
on invested capital. We will also continue to improve
our cost efficiency through various cost-containment
initiatives while ensuring we continue to deliver an
outstanding guest experience. We note the potential
for an increasing role of our tour operations which
include Royal Celebrity Tours and Pullmantur’s tour
businesses and other operations on our Net Yields
and Net Cruise Costs. We realize that revenues and
expenses associated with such operations tend to be
more volatile and less predictable than our main cruise
business. Because the tour businesses have relatively
low margins, this volatility has little impact on our
results of operations but can cause fluctuations in our
Net Yields and Net Cruise Costs.
Our international expansion also remains a key focus
going into 2011 and we continue to invest in mature
markets while strategically focusing on developing
markets. As a result, we are experiencing an increased
demand in these markets. We also continue to tacti-
cally invest in our fleet to ensure we maintain class
and brand standards including the addition of new
venues and other popular amenities across our fleet.
In addition, we recently reached a conditional agree-
ment with Meyer Werft to build the first of a new gen-
eration of Royal Caribbean International cruise ships.
Lastly, we have experienced a significant improve-
ment in our liquidity during 2010 due to the increase
in our operating cash flows coupled with the steps we
have taken so far to further reduce refinancing risk,
including obtaining an additional unsecured revolving
credit facility in 2010 with the goal of maintaining two
separate revolving credit facilities with staggered
maturity dates going forward. We also have committed
bank financing arrangements for our two Solstice-
class vessels under construction. We anticipate
funding our scheduled maturities in 2011 and other
obligations through operating cash flows and do not
foresee a need to access the capital markets during
2011 although we may opportunistically decide to do
so. We are also continuing to pursue our long-term
objective of returning to investment grade rating.
During 2010, Standard and Poor’s upgraded our cor-
porate credit rating and our senior unsecured debt
credit rating to BB with a stable outlook from BB– with
a stable outlook. In January 2011, Moody’s upgraded
our corporate credit rating to Ba1 with a stable out-
look from Ba2 with a stable outlook and our senior
unsecured debt credit rating to Ba2 with a stable out-
look from Ba3 with a stable outlook.
RESULTS OF OPERATIONS
Summary
YEAR ENDED DECEMBER 31, 2010
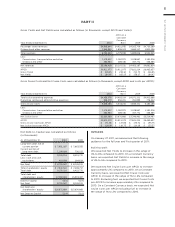
Total revenues increased 14.6% to $6.8 billion in 2010
from total revenues of $5.9 billion in 2009 primarily
due to an 11.1% increase in capacity (measured by
APCD for such period) and a 4.2% increase in Net
Yields. The increase in Net Yields was primarily due
to increases in ticket prices and occupancy, partially
offset by the adverse effect of changes in foreign cur-
rency exchange rates. This increase in total revenues
was also partially offset by higher operating expenses
primarily due to the increase in capacity, in part offset
by the favorable effect of changes in foreign currency
exchange rates. In addition, during 2010, we recorded
a one-time gain of approximately $89.0 million, net of
costs and payments to insurers, related to the settle-
ment of our case against Rolls Royce. As a result, our
net income was $547.5 million or $2.51 per share on a
diluted basis for 2010 compared to $162.4 million or
$0.75 per share on a diluted basis for 2009.
Significant items for 2010 include:
• Net Cruise Costs per APCD decreased by 1.8% com-
pared to 2009.
• Fuel expenses per APCD, net of the financial impact
of fuel swap agreements, decreased 3.0% per APCD
as compared to the same period in 2009.
• Our Net Debt-to-Capital ratio increased to 52.4% in
2010 from 52.0% in 2009. Similarly, our Debt-to-
Capital ratio increased to 53.5% in 2010 from 52.9%
in 2009.