Radio Shack 2013 Annual Report Download - page 66
Download and view the complete annual report
Please find page 66 of the 2013 Radio Shack annual report below. You can navigate through the pages in the report by either clicking on the pages listed below, or by using the keyword search tool below to find specific information within the annual report.-
 1
1 -
2
-
3
-
4
-
5
-
6
-
7
-
8
-
9
-
10
-
11
-
12
-
13
-
14
-
15
-
16
-
17
-
18
-
19
-
20
-
21
-
22
-
23
-
24
-
25
-
26
-
27
-
28
-
29
-
30
-
31
-
32
-
33
-
34
-
35
-
36
-
37
-
38
-
39
-
40
-
41
-
42
-
43
-
44
-
45
-
46
-
47
-
48
-
49
-
50
-
51
-
52
-
53
-
54
-
55
-
 56
56 -
 57
57 -
 58
58 -
 59
59 -
 60
60 -
 61
61 -
 62
62 -
 63
63 -
 64
64 -
 65
65 -
 66
66 -
 67
67 -
 68
68 -
 69
69 -
 70
70 -
 71
71 -
 72
72 -
 73
73 -
 74
74 -
 75
75 -
 76
76 -
77
-
78
-
79
-
80
 |
 |

64
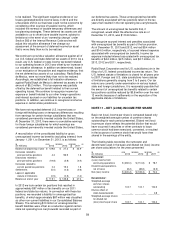
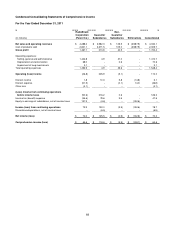
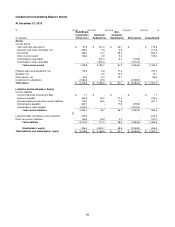
NOTE 15 – QUARTERLY DATA (UNAUDITED)
As our operations are retail oriented, our business is subject to seasonal fluctuations, with the fourth quarter generally being
the most significant in terms of sales and profits because of the winter holiday selling season.
Three Months Ended
March 31,
June 30, September 30,
December 31,
(In millions, except per share amounts) 2013 2013 2013 2013
Net sales and operating revenues $ 849.0 $ 844.5
$
805.4
$
935.4
Cost of products sold
(1) (2)
511.7 530.7
562.7 657.0
Gross profit 337.3 313.8
242.7 278.4
Operating expenses:
Selling, general and administrative 337.9 336.9
343.3 389.3
Depreciation and amortization 16.5 15.5
15.0 14.4
Impairment of long
-
lived assets and goodwill
(3)
1.4 2.8
2.4 40.8
Total operating expenses 355.8 355.2
360.7 444.5
Operating loss (18.5)
(41.4)
(118.0) (166.1)
Interest income 0.4 0.3
0.3 1.2
Interest expense (15.0)
(14.1)
(11.5) (11.7)
Other loss
(4)
(0.3)
--
-- (10.6)
Loss from continuing operations before income taxes (33.4)
(55.2)
(129.2) (187.2)
Income tax expense (benefit) 1.4
(1.8)
(16.8) 4.2
Loss from continuing operations (34.8)
(53.4)
(112.4) (191.4)
Discontinued operations, net of income taxes (8.5) 0.3
-- --
Net loss $ (43.3) $
(53.1)
$
(112.4)
$
(191.4)
Basic and diluted net loss per share:
Loss per share from continuing operations $ (0.35) $
(0.53)
$
(1.11)
$
(1.90)
Loss per share from discontinued operations (0.08)
--
-- --
Net loss per share $ (0.43) $
(0.53)
$
(1.11)
$
(1.90)
Shares used in computing net loss per share:
Basic and diluted 100.4 100.7
101.0 101.0
Comprehensive loss $ (39.0) $
(56.7)
$
(113.2)
$
(189.9)
(1) The third quarter includes inventory losses of $46.6 million resulting from the removal of products from the inventory assortment.
(2) The fourth quarter includes a $10.1 million inventory write down related to our proposed store closure program.
(3) The fourth quarter includes a goodwill impairment charge related to our Mexican subsidiary of $23.7 million and an $11.2 million fixed asset impairment
charge related to our proposed store closure program.
(4) The fourth quarter includes a $10.6 million debt extinguishment charge related to our repayment of debt in December 2013.
The sum of the quarterly net income per share amounts may not total to each full year amount because these computations
are made independently for each quarter and for the full year and take into account the weighted-average number of common
stock equivalent shares outstanding for each period, including the effect of dilutive securities for that period.