Radio Shack 2013 Annual Report Download - page 24
Download and view the complete annual report
Please find page 24 of the 2013 Radio Shack annual report below. You can navigate through the pages in the report by either clicking on the pages listed below, or by using the keyword search tool below to find specific information within the annual report.-
 1
1 -
2
-
3
-
4
-
5
-
6
-
7
-
8
-
9
-
10
-
11
-
12
-
13
-
 14
14 -
 15
15 -
 16
16 -
 17
17 -
 18
18 -
 19
19 -
 20
20 -
 21
21 -
 22
22 -
 23
23 -
 24
24 -
 25
25 -
 26
26 -
 27
27 -
 28
28 -
 29
29 -
 30
30 -
 31
31 -
 32
32 -
 33
33 -
 34
34 -
35
-
36
-
37
-
38
-
39
-
40
-
41
-
42
-
43
-
44
-
45
-
46
-
47
-
48
-
49
-
50
-
51
-
52
-
53
-
54
-
55
-
56
-
57
-
58
-
59
-
60
-
61
-
62
-
63
-
64
-
65
-
66
-
67
-
68
-
69
-
70
-
71
-
72
-
73
-
74
-
75
-
76
-
77
-
78
-
79
-
80
 |
 |

22
commercial customers, and sales to other third parties
through our global sourcing operations. Each of these
business activities accounted for less than 5% of our
consolidated net sales and operating revenues in 2013.
Other sales decreased $35.4 million, or 9.4%, when
compared with last year. This sales decrease was driven
primarily by sales decreases to our independent dealers
and at radioshack.com.
Gross Profit
Consolidated gross profit and gross margin are as follows:
Year Ended December 31,
(In millions) 2013
2012
2011
Gross profit
$
1,172.2
$ 1,470.4
$ 1,722.4
Gross profit decrease (20.3)%
(14.6)%
(8.9)%
Gross margin rate 34.1 %
38.4 %
42.7 %
Gross profit decreased by $298.2 million, or 20.3%, to
$1,172.2 million when compared with last year. This
decrease was primarily driven by our decreased revenue
and our decreased gross margin rate. Gross margin rate
decreased by 4.3 percentage points from last year to
34.1%. The decrease in our consolidated gross margin rate
was a result of: a change in sales mix towards higher-
priced and lower gross margin rate smartphones; inventory
valuation losses associated with our transition to an
improved merchandise assortment; more aggressive sales
promotions such as aggressive discounts, clearance
events, and customer coupons; and inventory write downs
related to our proposed store closure program.
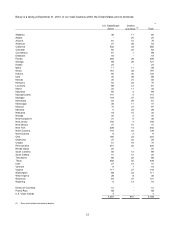
Selling, General and Administrative Expense
Our consolidated SG&A expense decreased 0.9%, or $12.4 million, in 2013. SG&A as a percentage of net sales and operating
revenues increased 3.9 percentage points when compared with 2012. This percentage point increase was a result of our
decrease in net sales and operating revenues in 2013. The table below summarizes the breakdown of various components of
our consolidated SG&A expense and their related percentages of total net sales and operating revenues.
Year Ended December 31,
2013 2012 2011
% of % of % of
(In millions) Dollars Revenues
Dollars Revenues
Dollars Revenues
Compensation $ 594.6 17.3 % $ 618.1 16.1
% $ 621.0 15.4
%
Rent and occupancy 249.1 7.3 252.3 6.6
261.5 6.5
Advertising 176.2 5.1 175.8 4.6
203.1 5.0
Other 387.5 11.3 373.6 9.8
389.1 9.7
$ 1,407.4 41.0 % $ 1,419.8 37.1
% $ 1,474.7 36.6
%
The decrease in SG&A expense was driven by the fact that
we operated fewer stores in 2013 than in 2012, and by $8.5
million in severance costs recognized in 2012 in connection
with the departure of our Chief Executive Officer combined
with the termination of employment of certain corporate
headquarters support staff. The increase in Other SG&A
was driven by increased professional fees and increased
self-insurance costs related to workers compensation and
theft losses. This increase was partially offset by the receipt
of $5.3 million from a non-merchandise vendor as
settlement of a dispute and a $2.4 million gain on the sale
of a building.
Depreciation and Amortization
The table below provides a summary of our total
depreciation and amortization by segment.
Year Ended December 31,
(In millions) 2013 2012
2011
U.S. RadioShack
company-operated stores $ 29.9 $ 31.8
$ 37.9
Other 4.4 3.8
4.0
Unallocated 36.1 38.7
36.2
Total depreciation and
amortization from
continuing operations $
70.4 $
74.3
$
78.1
The table below provides an analysis of total depreciation
and amortization.
Year Ended December 31,
(In millions) 2013 2012
2011
Depreciation and
amortization expense $ 61.4 $ 65.9
$ 70.6
Depreciation and
amortization included
in cost of products sold 9.0 8.4
7.5
Total depreciation and
amortization from
continuing operations $
70.4 $
74.3
$
78.1
The decreasing trend in depreciation expense from 2011 to
2013 was driven by lower capital expenditures in 2012 and
2013, combined with increased long-lived asset
impairments during these periods.
Impairment of Long-Lived Assets and Goodwill
Impairment of long-lived assets and goodwill was $47.4
million in 2013 compared with $9.7 million in 2012.
U.S. RadioShack Company-Operated Stores:
Impairments for long-lived assets held and used in certain
stores were $23.3 million in 2013, compared with $9.7
million in 2012. The 2012 amounts included a goodwill
impairment charge of $3.0 related to our U.S. RadioShack
company-operated stores reporting unit. The remaining
increases were primarily driven by increases in the number